
Our Top Picks


Sales conversion has always been and will be a challenge. And the irony is that this particular hurdle isn’t dependent on the business’s age or timeline.
Theoretically, or for argument’s sake, one can say that the older a business is, it would make sense for the managers and appointed marketing heads to know how conversions work, the type of audience a business caters to, and vice versa.
However, the problem is two-fold.
We’ve got an influx of outside variables where competition is evolving, and so is the technological aspect, where tons of tools are available to track outbound cold calling businesses’ sales and conversions.
As a result, these two factors affect the way any new or existing business needs to adopt new changes by the hour. On top of that, despite the “age” factor, many business owners are sometimes oblivious to the exact sales productivity and performance metrics. It eventually causes things to go stale - and if it’s left unchecked, business revenue can substantially dwindle.
Without the right measurements, it’s like steering a ship without a compass — you might be moving fast, but you could be heading in the wrong direction.
The reality is that today’s sales teams have access to more data than ever before. CRMs, sales engagement platforms, email tracking software — they all churn out a flood of numbers daily. The real challenge is knowing which sales performance metrics matter, which ones are noise, and how they all connect to your sales pipeline performance and overall revenue goals.
The good news is that we’ve got this exclusive in-depth guide to help you cut through that noise. You’ll learn how to measure sales productivity, identify the best sales rep productivity metrics, and understand how these numbers feed into your team’s ability to hit targets.
So, let’s get started…
What is Sales Productivity?

Before you can measure it, you need to know exactly what it means.
Sales productivity is essentially the balance between efficiency and effectiveness in a sales role. It’s about how quickly and effectively your team can turn prospects into paying customers — without burning unnecessary resources.
Here are two things you need to keep in mind. In fact, write them down somewhere:
- Efficiency is about doing things right.
- Effectiveness is about doing the right things.
Both matter.
Therefore, a rep who sends 200 cold emails a day but gets zero responses isn’t productive, even if they’re working at high speed. Conversely, a rep who spends a week nurturing a single lead that never closes also isn’t productive.
From a business perspective, measuring sales rep productivity means asking or figuring out one of the following:
- How much revenue is each rep generating relative to the time and resources invested?
- Are their activities translating into meaningful pipeline movement?
- Are they consistently meeting or exceeding quota?
The most straightforward way to evaluate whether your staffing decisions are paying off is to calculate the total revenue your team generates divided by their total working hours.
Why Tracking Sales Performance Metrics Matters
If you can’t measure it, you can’t improve it.
Period. It’s plain and simple as that.
Sales performance metrics don’t just help you keep score — they tell you where to focus your energy. They show you which reps are thriving, which ones are struggling, and which parts of your sales process are slowing everyone down.
Clear measurement:
- Creates accountability by making performance visible.
- Helps managers set realistic sales quotas based on actual performance trends.
- Supports better coaching by pinpointing the exact stage where deals stall.
- Identifies opportunities to increase sales productivity through process improvements or better tools.
Common Challenges of Measuring Sales Productivity
Oddly enough, the biggest problem today isn’t lack of data — it’s too much data.
We’ve got an abundance of CRM reporting tools that can produce hundreds of different metrics, but tracking the wrong ones can lead to what many sales leaders call "vanity metrics." These look good on paper but don’t actually help you close more deals.
For example:
- Counting the number of calls without tracking conversion rates.
- Measuring how fast deals close without considering deal size.
- Pushing for more proposals sent without looking at proposal-to-close ratios.
As Patrick William Joyce, Business Development Advisor, points out, if you set activity targets without considering outcomes, reps will game the system. They’ll make low-quality calls or send irrelevant emails just to hit their numbers. That’s not sales efficiency — that’s wasted effort.
And it happens a lot!
You can trust us on that. To mitigate this issue, many businesses implement time and activity tracking software, but it can also be gamed.
Reps simply complete their dedicated activities for the sake of it, punching in the hours and cashing their paycheck. It eventually causes the business to run dry over the course of time.
How to Measure Sales Productivity in a Way That Actually Works
Before you start collecting numbers, define what sales productivity means for your organization. In some businesses, it’s purely revenue per sales rep. In others, it’s weighted toward long-term relationship building, where deal value grows over time.
Here’s how to get started:
- Check industry benchmarks – Use sources like The Bridge Group or sales community insights to see where you stand.
- Track both leading and lagging indicators – Leading indicators (like meetings booked) help predict future success. Lagging indicators (like revenue closed) confirm it.
- Reverse-engineer your targets – If your average deal size is $50,000 and your rep’s annual quota is $500,000, they need to close 10 deals a year. If their win rate is 20%, they’ll need 50 qualified opportunities.
20 Sales Productivity Metrics That Matter
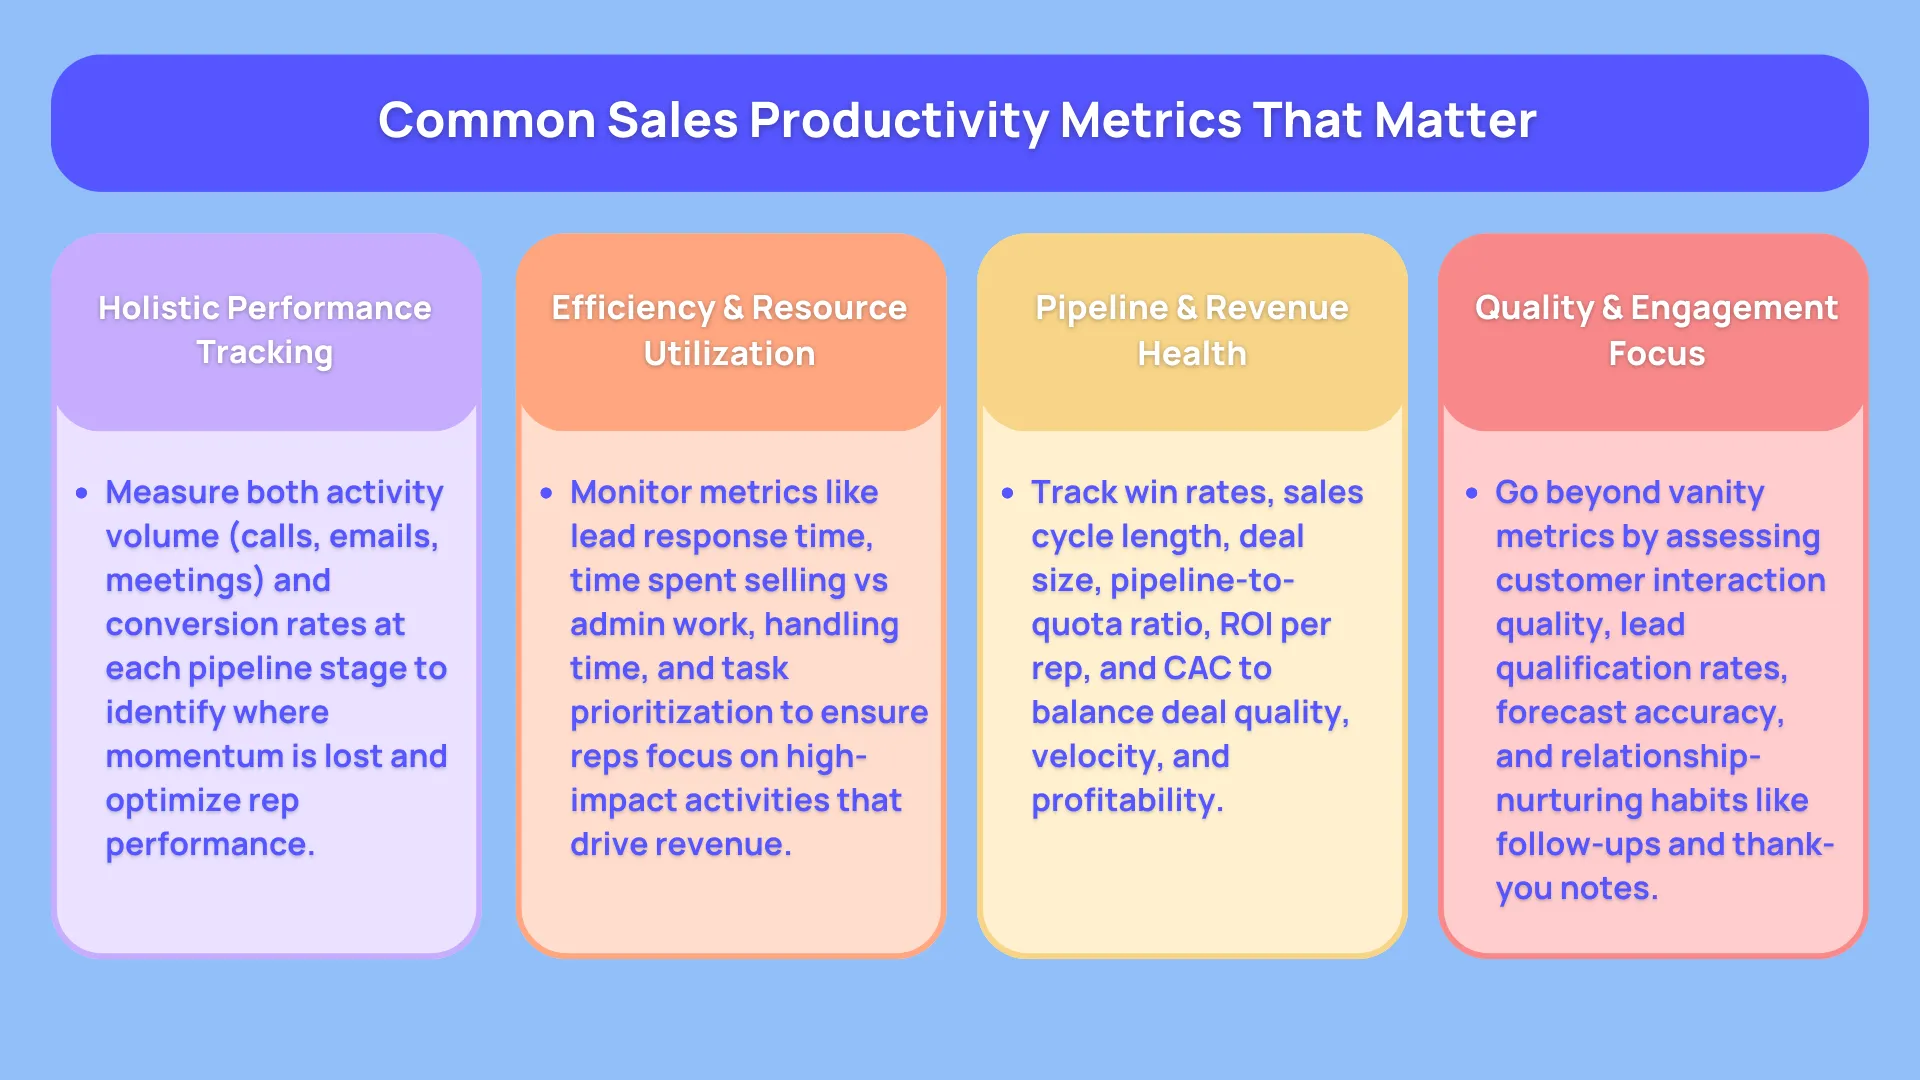
Each of the following metrics gives you a different angle on how to measure sales rep productivity. When combined, they provide a 360° view of your team’s sales pipeline performance, efficiency, and results.
1. Activity Metrics and Conversions
Activity metrics measure the raw volume of selling activities — calls made, emails sent, LinkedIn touches, demos, and meetings. But the real insight comes when you pair these with conversion data.
Example:
- Calls made → Conversations → Meetings booked → Opportunities created → Deals closed.
As a manager or someone in charge of a team, if you were to do a thorough sales conversion rate analysis at each stage, you’d quickly see where reps are losing momentum. If conversations aren’t leading to meetings, your outreach messaging might be off. If meetings aren’t creating opportunities, maybe the prospect fit isn’t right.
2. Average Lead Response Time
Speed matters. Studies show reps who respond within 5 minutes are far more likely to connect and qualify a lead than those who wait. Sales activity tracking in your CRM should show how quickly leads move from “new” to “contacted.”
Slow response times usually point to:
- Overloaded reps
- Poor task prioritization
- Lack of automated lead routing
3. Average Handling Time
This measures how long reps spend on each interaction, from phone calls to proposal follow-ups. Shorter isn’t always better — the goal is to handle interactions efficiently without sacrificing quality.
Long handling times may mean:
- Reps lack the right tools to speed up workflows.
- They’re bogged down by manual admin tasks instead of selling.
4. Time Spent Selling vs Admin Tasks
If your sales dashboard analytics shows that reps spend more than half their time on admin instead of actual selling, that’s a productivity red flag.
Track time allocation across:
- Prospecting
- Meetings and calls
- Proposal prep
- CRM updates and reporting
Then remove or automate low-value admin work wherever possible.
5. Opportunities Lost
Every lost deal is lost time. Track sales pipeline performance by measuring the percentage of opportunities that end in “closed-lost,” and categorize the reasons — pricing, competition, no decision, etc.
If no-decision losses are high, reps might be qualifying too loosely. If competition wins are high, your value proposition may need sharpening.
6. Win Rates
Win rate = (Closed-won deals ÷ Total opportunities) x 100.
This is a direct indicator of sales rep productivity. A low win rate might mean poor qualification, weak closing skills, or a mismatch between your offering and your ICP.
7. Length of Sales Cycle
This is the average time it takes to move a prospect from initial contact to closed deal. Shorter cycles usually mean higher sales efficiency KPIs — but only if deal value stays healthy.
If cycles are too long, look for:
- Bottlenecks in approvals or proposal delivery
- Overcomplicated contract processes
- Reps chasing unready prospects
8. Average Deal Size
Small deals are fine if they’re quick and plentiful. Large deals are worth more but may require longer cycles. The key is balancing both for a steady revenue flow.
Monitoring deal size across the team can highlight coaching opportunities. New reps may start with smaller deals but should gradually build toward larger, more strategic wins.
9. Time-to-Productivity for New Hires
How long does it take a new rep to become fully quota-bearing? This metric reveals the effectiveness of your onboarding process and tool adoption.
Track milestones like:
- Time to first meeting
- Time to first deal
- Time to 100% quota attainment
10. Sales Pipeline-to-Quota Ratio

Think of your sales pipeline as the fuel tank for your revenue engine. The pipeline-to-quota ratio measures how much potential business is sitting in the pipeline compared to a rep’s sales quota.
As a general rule of thumb, you should keep in mind that a healthy pipeline contains 3–5 times the value of the rep’s quota. So, if a rep’s quarterly target is $500,000, they should have between $1.5 million and $2.5 million in pipeline value. This buffer accounts for the fact that not every opportunity will close.
A low ratio is a red flag that a rep simply doesn’t have enough opportunities to work with — which means they’re more likely to miss quota, no matter how skilled they are. A ratio that’s too high might indicate overstuffing the pipeline with low-quality deals just to make the numbers look better.
The key is balance. This metric is most powerful when combined with sales pipeline performance tracking to ensure the deals in the pipeline are real, qualified, and moving forward.
11. ROI Per Rep
Revenue per sales rep isn’t just about bragging rights — it’s a critical sales efficiency KPI that measures the return on investment for each person on the team.
To calculate it, divide the revenue a rep generates over a given period by the total cost of employing them (salary, commission, benefits, and any overhead tied to their role).
This number helps leaders see if the sales team is pulling its financial weight. If ROI is low, it may point to one of several issues:
- The rep isn’t closing enough deals.
- They’re working with low-value opportunities.
- Your sales process is inefficient, slowing down performance.
High ROI reps are not only worth keeping — they’re worth learning from. Document their workflows, prospecting methods, and closing strategies so others can model their success.
12. Quality of Customer Interactions
It’s tempting to measure sales rep productivity purely by activity volume — how many calls, emails, or meetings they complete. But quality beats quantity every time.
Instead of counting calls for the sake of it, focus on meaningful interactions that move deals forward. Key measures include:
- Dials – The total number of outbound calls made.
- Conversations with qualified prospects – How many of those dials resulted in speaking to someone who matches your ideal customer profile (ICP)?
- Appointments set – How many conversations progressed to scheduled meetings or demos?
Tracking this helps you spot reps who are spinning their wheels versus those who are turning each interaction into a step toward a sale.
13. Stage-by-Stage Pipeline Conversion
A sales pipeline isn’t just a list of deals — it’s a journey, with multiple stages from first contact to closed-won. Stage-by-stage conversion rates show how many deals progress at each step, and where they drop off.
For example:
- 100 opportunities in the “qualified” stage
- 70 move to “proposal sent”
- 50 reach “negotiation”
- 30 close as wins
If there’s a steep drop-off between two stages, it tells you exactly where to focus training and process improvements. This metric can also reveal which reps are strong closers but weak qualifiers, or vice versa.
14. Forecast Accuracy
Accurate forecasting is the backbone of business planning. If your sales forecast is constantly missing actual results, you’re either overestimating what’s in the pipeline or underestimating potential wins.
Low forecast accuracy can cause major problems:
- Overestimating leads to overspending on resources you can’t actually support.
- Underestimating may cause you to hold back investments or hiring that could have fueled growth.
Regularly compare forecasted revenue against actuals to fine-tune your projection models and improve sales dashboard analytics reliability.
15. Thank-You Notes and Follow-Ups
In an era of automation and AI, personal touches stand out more than ever. A quick, thoughtful thank-you note — especially handwritten — can make a lasting impression on prospects and customers.
Why does this matter for productivity? Because relationship nurturing isn’t fluff; it’s the foundation of repeat business and referrals. Some of the most successful reps make it a habit to send thank-you notes after meetings, contract signings, or even referrals.
You can track this in your CRM under activity notes or tags. Over time, you may notice a correlation between high follow-up activity and stronger long-term deal flow.
16. Task Prioritization Metrics
A rep’s day can easily get swallowed by low-value activities if they don’t prioritize correctly. Task prioritization metrics show whether reps are spending time on activities that directly impact the pipeline.
CRMs and sales activity tracking tools let you sort and monitor tasks by due date, importance, and type. If a rep is consistently missing follow-up deadlines or spending hours on tasks unrelated to closing deals, it’s time for a reset on time management.
17. Lead Qualification Rate
Not every lead deserves to be in the pipeline. The lead qualification rate measures the percentage of leads that meet your agreed qualification criteria (budget, authority, need, and timeline — the classic BANT model, or your own version).
Low qualification rates can mean:
- Marketing is sending over too many unfit leads.
- Reps are rushing leads into the pipeline without enough discovery.
Either way, it’s a metric worth watching because it directly affects sales conversion rate analysis and win rates.
18. Customer Acquisition Cost (CAC)
This is the total cost of landing a new customer, including marketing spend, sales salaries, commissions, and any tools or resources used in the process. Pairing CAC with revenue per sales rep helps you evaluate whether your selling efforts are profitable.
If CAC is too high, you may need to shorten the sales cycle, improve qualification rates, or refine your target market so you’re focusing on higher-value prospects.
19. Sales Quota Attainment
At the end of the day, this is the ultimate sales performance metric — the percentage of quota each rep actually achieves.
Tracking quota attainment over multiple quarters shows whether performance is stable, improving, or declining. Consistently high attainment may suggest it’s time to set more ambitious goals. Consistently low attainment might mean quotas are unrealistic — or that the team needs stronger support, training, and tools to meet them.
20. Sales Dashboard Analytics Utilization
Many companies invest in powerful CRM reporting tools, but the value only comes if reps and managers actually use them. Sales dashboard analytics can show you real-time data on pipeline health, activity tracking, and deal progress, but only if the data going in is accurate and the team actively engages with it.
Low dashboard usage is a warning sign that reps may not be logging activities properly, which undermines the accuracy of all your other sales efficiency KPIs.
How Can You Help Make Your Sales Team Most Productive?
Measuring is only half the battle. The real question is: How can you help make your sales team most productive? Numbers without action are just numbers.
Here’s how you can translate metrics into meaningful performance improvements:
- Remove unnecessary admin tasks
Reps should be selling, not drowning in data entry. Automate CRM updates, use meeting transcription tools, and standardize reporting so they can focus on revenue-generating activities. - Provide continuous coaching based on real data
Don’t wait for quarterly reviews. Use ongoing sales activity tracking and pipeline metrics to give targeted, in-the-moment coaching. - Invest in tools that truly help
Choose tools that make work easier, not more complicated. The right CRM reporting tools should save time, not add more clicks. - Reward both efficiency and results
Closing deals matters, but so does building a healthy pipeline, improving win rates, and reducing sales cycle length. Recognize and reward these improvements alongside revenue wins.
In the end, whenever you combine sales performance metrics with actionable strategies to increase sales productivity, you’re not just tracking numbers — you’re building a sales team that consistently hits, and even exceeds, their targets.
Having said that, start out with small, realistic targets that are easy to achieve in terms of tracking conversion metrics.
Rinse and repeat and scale your efforts while keeping a close eye on your competitors. There’s no secret sauce; just a bunch of good old strategies that are improvised over time and combined with the metrics that bring in the best results. That’s all there is to it.
Good luck!
.jpeg)

Embed Trellus Parallel Dialer Within Your SEP & 4x Your Conversations