Our Top Picks


Sales performance rarely tells a clear story when viewed through a single number.
New accounts closed and total revenue matter, but they only show the final outcome. On the contrary, as opposed to traditional approaches, the real insights live in the patterns behind those results. Sales performance metrics help uncover how deals move through the funnel, where momentum builds, and where it quietly breaks down.
As a matter of fact, many strong sales teams, these days, actively rely on a mix of sales metrics, sales KPIs, and sales performance indicators to understand activity, efficiency, and outcomes.
If you’re struggling to understand sales performance metrics, or let alone, which KPIs to track as per your business and use case, this detailed post is for you.
We have broken down every possible and the most important KPIs that are relevant to people in the sales industry.
So, let’s get started and see what we have in store for you.
What Are Sales Performance Metrics and Why Do They Matter?

Sales performance metrics are measurable data points that show how a sales organization operates at both the individual and team level.
At any point, during a business’s lifecycle, they reveal effort, quality, speed, and results across the entire sales motion.
At a practical level, sales metrics answer questions like how much activity reps generate, how prospects respond, and how long revenue takes to materialize. At a strategic level, sales KPIs connect those numbers to business outcomes such as growth, retention, and profitability.
Tracking sales productivity metrics helps leaders identify patterns early.
Similarly, strong activity metrics paired with weak conversion rates point to messaging or qualification gaps. Healthy pipelines paired with slow deal movement highlight friction in the sales process. Without this visibility, coaching, forecasting, and compensation planning turn into educated guesses rather than informed decisions.
Understanding key performance indicators like sales per labour hour, conversion rates, and average transaction value is essential for measuring overall sales team effectiveness and identifying areas for improvement.
Sales Metrics vs Sales KPIs: Understanding the Difference
The most important thing to understand about these metrics is that tracking all of them, or setting KPIs relevant to all the metrics that we have discussed in this post, is not important.
You need to understand your business model, the competition out there, and the type of audience you’re catering to. That way, you only select a handful of metrics that are related to the industry and the most important aspects of your business.
For instance, some of the metrics we have highlighted in this post are related to outbound sales teams and their individual/ combined performance. Meanwhile, other metrics are general in nature, as in they allude to a sales model that practically applies to all kinds of sales platforms. So, while keeping that in mind, you’ll begin to understand that every single sales KPI and metric exists for a specific purpose.
That being said, here’s an example of outbound sales call metrics:
They normally include calls made, emails sent, demos booked, or deals closed. These metrics show what is happening day to day inside the sales engine.
- Fun Fact: According to Statista, the average sales conversion rate is somewhere between 2.46% to 3.26%
Likewise, if we were to talk about metrics associated with different workflows in a CRM, then you should know that CRMs are meant for aligning sales metrics with sales KPIs that overlook a wider range of business operations.
Sales Funnel Metrics: Visibility at Every Stage
Sales metrics carry the most value when tracked across the full funnel.
From that point of view, if you were to set up sales performance and metric related KPIs at different levels, such as first touch, closed revenue, lost deals and vice versa, you’d be able to identify those key areas where your business is lacking.
Take the example of a SaaS company generating 1,000 leads in a month. Two hundred of those leads turn into qualified prospects, one hundred book demos, and twenty five close. A sudden drop in demo to close conversion raises red flags. Pricing may be misaligned, follow ups may lag, or discovery calls may lack depth.
Sales pipeline metrics shine a light on these moments. Without funnel stage tracking, teams feel the pain of missed revenue long after the cause has already passed.
What Is a Good Sales Growth Rate?

Good question.
And the honest answer would be to perform an audit of your business and come up with actionable results. Otherwise, it’s just a matter of having a gist or getting by with information that isn’t plausible in the first place.
As a general rule of thumb, many established businesses often see healthy progress in the five to seven percent range. Growth between fifteen and twenty percent signals strong execution. High growth companies, especially in SaaS or emerging markets, often exceed twenty five percent.
Sales performance metrics help contextualize growth. Quarterly sales growth shows short term momentum. Year over year growth reveals long term strategy effectiveness. Both play different roles in sales metrics reporting and forecasting.
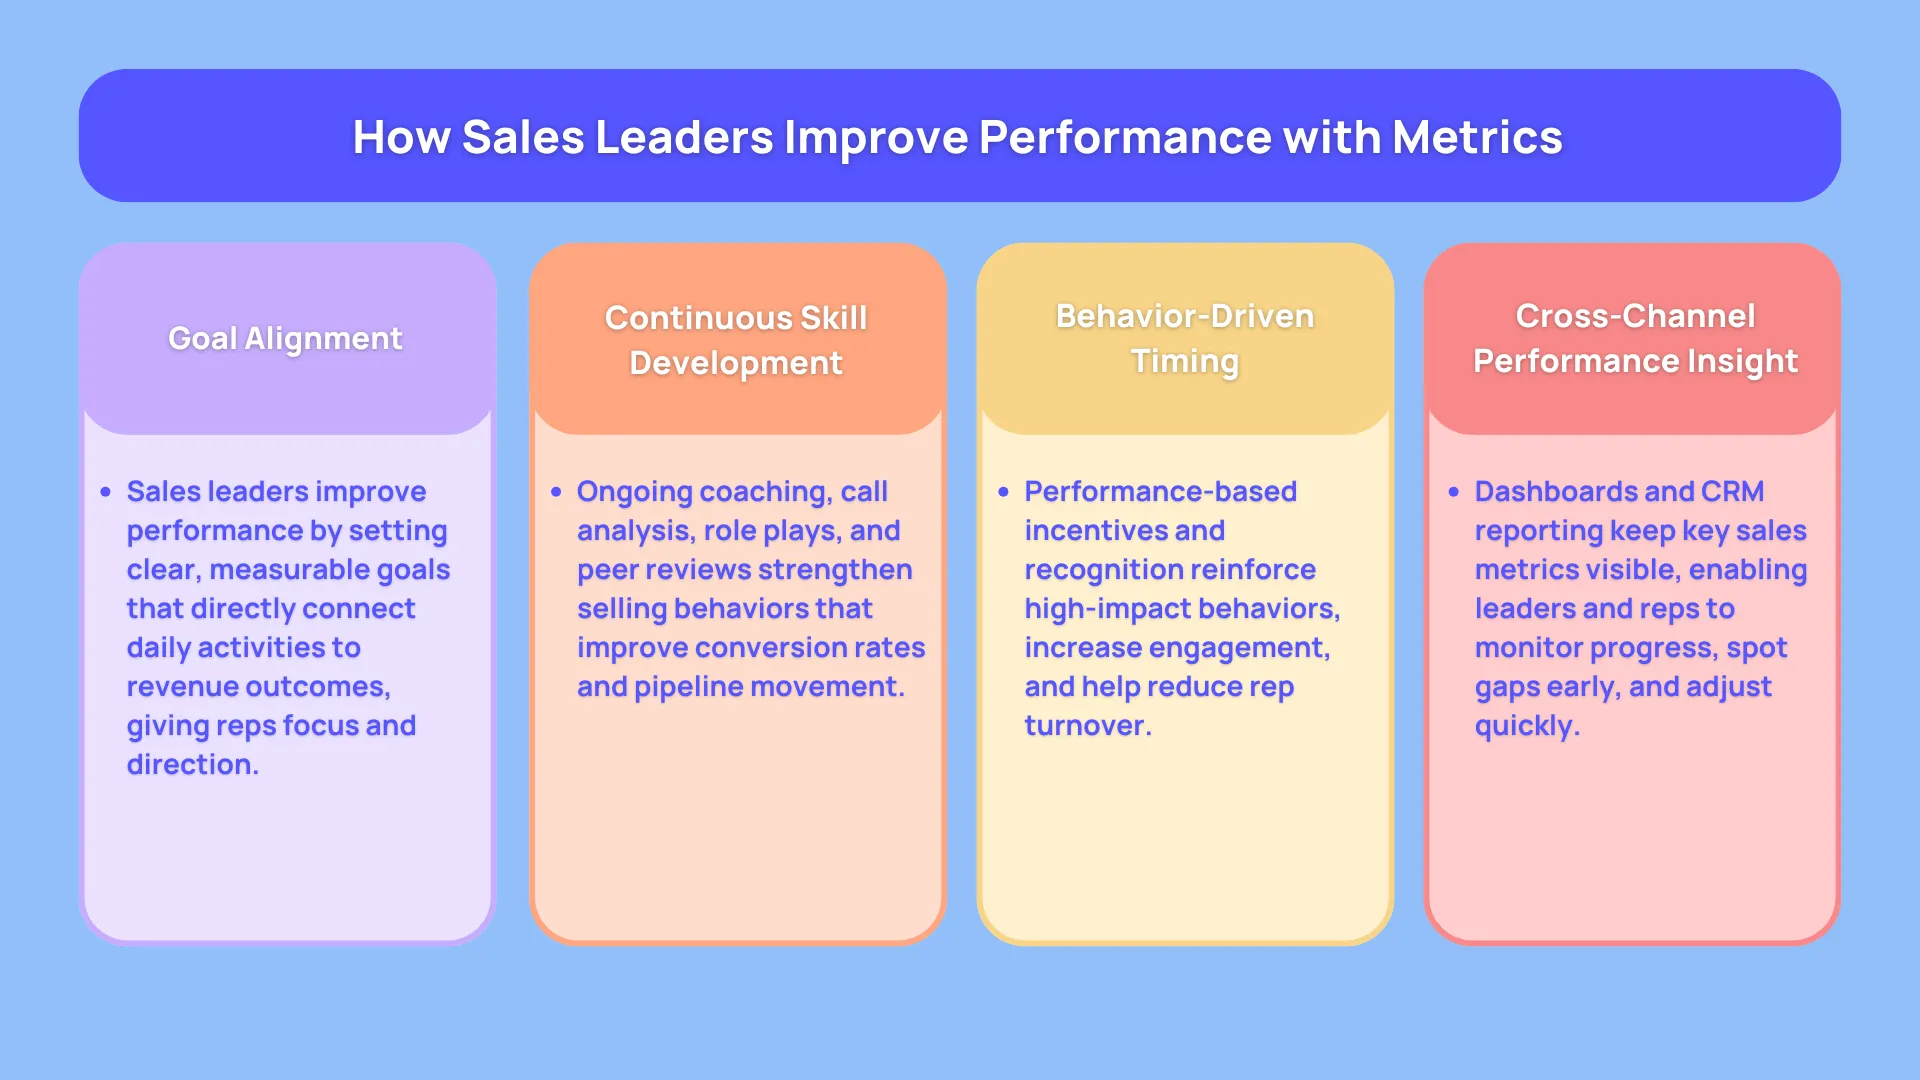
How Sales Leaders Improve Performance with Metrics
Clear and Measurable Goals
Sales goals work best when they connect activity to outcomes.
Targets like increasing quota attainment for Product X by fifteen percent within a quarter give reps clarity and focus. Sales KPIs to track should always tie back to goals that feel concrete and achievable.
Ongoing Skill Development
Sales productivity metrics often improve when teams receive consistent coaching.
- Fun Fact: According to Gong, successful SDRs sporadically use collaborative words like “We”, “Us”, and “Our”, and single out words like “I” and “Me” to be more impactful at making sales.
Workshops, peer reviews, role plays, and call analysis sharpen skills that directly affect conversion metrics and pipeline velocity.
Incentives and Recognition
Performance based incentives tied to sales outcome metrics reinforce the behaviors that drive revenue. Recognition also boosts rep engagement scores, which often correlate with lower turnover and stronger results.
Visibility into Performance
A sales performance dashboard keeps metrics top of mind.
Dashboards built into CRM systems allow teams to track sales metrics benchmarks, activity metrics, and revenue metrics in real time.
Core Sales KPIs Every Team Should Track
Once again, these sales KPIs are not specific to any particular category of business.
You need to improvise and either make a few additions, or take out “irrelevant” metrics that aren’t of any or a high level of significance at the moment.
1. Monthly Sales Growth
Monthly sales growth tracks momentum over time. It highlights seasonal patterns, campaign impact, and shifts in buyer behavior.
Sales leaders rely on this metric to spot early signs of acceleration or slowdown and adjust strategy before quarterly results suffer.
2. Quota Attainment Rate
Quota attainment shows how many reps meet or exceed their targets.
This sales team metric reveals goal realism, coaching effectiveness, and territory balance. Consistently low attainment signals deeper issues that dashboards alone cannot hide.
3. Customer Satisfaction Score
Customer satisfaction reflects the quality of the buying experience.
High satisfaction supports renewals, referrals, and upsells. Poor scores often predict churn long before revenue declines show up in reports.
4. Total Sales Revenue
Total sales revenue remains one of the most important sales metrics. On top of that, conversions are likely to be a higher percentage when sales are made through a digital solution.
According to the experts at LinkedIn, almost 75% to 85% of top salespeople either use CRMs, or other productivity apps to close a higher number of sales.
In other words, it easily captures the final output of all sales activity. Leaders use it to assess overall performance and individual contribution while pairing it with efficiency metrics for deeper insight.
5. Net Revenue Retention
Net revenue retention measures how well existing customers expand or contract over time.
For SaaS teams, NRR acts as a health indicator for long term growth. Strong onboarding, clear value communication, and timely upsells support higher retention. Aside from that, here’s an interesting piece of info for sales managers” If the price of your products and services is equal to whatever’s out there, then shoppers and clients are more likely to make deals in person. ‘PewResearch’ suggests that almost 64% of Americans would rather shop in person than online.
Sales and Customer Activity Based Metrics That Drive the Funnel
Activity metrics sit at the very top of the sales funnel.
They measure effort, consistency, and execution before revenue ever enters the picture. While these numbers do not guarantee closed deals on their own, they strongly influence pipeline creation, sales velocity metrics, and long term quota attainment.
For sales leaders, these sales activity metrics answer a simple but critical question. Is the team doing enough of the right work to create future revenue.
6. Number of Calls Made
The number of calls made tracks outbound calling activity over a defined period.
This sales performance metric reflects effort, prioritization, and time management at an individual and team level.
- Fun Fact: Almost 80% to 92% of the individuals in the sales industry give up when receiving “No” for an answer. According to the experts at ‘TheMarketingDonut’, a high percentage of prospects are likely to say No before they convert.
Call volume matters because live conversations still play a major role in pipeline creation, especially for outbound and mid market sales motions. Low call activity often explains thin pipelines long before win rates or revenue metrics decline. For SDR teams in particular, this metric acts as a baseline indicator of discipline and focus.
That said, call volume should never be viewed in isolation. High activity paired with low conversion rates suggests issues with targeting, talk tracks, or call quality. Strong sales analytics connect call volume with meetings booked and win rates to ensure effort translates into progress rather than noise.
7. Email Open Rate
Email open rate measures the percentage of sent emails that prospects actually open.
Open rates reflect subject line quality, sender reputation, timing, and list relevance. When open rates fall, it rarely points to effort problems. Instead, it highlights messaging gaps or deliverability challenges. Poor open rates mean prospects never see the value inside the message, making response rates and meetings impossible regardless of rep skill.
Among sales metrics examples, open rate acts as an early diagnostic tool. It allows teams to adjust subject lines, personalization strategies, and cadence structure before deeper funnel metrics suffer.
8. Email Response Rate
Email response rate tracks how many prospects reply to outbound messages.
Responses indicate that messaging resonates with real pain points. When response rates climb, teams usually see downstream improvements in meetings booked and pipeline velocity. Low response rates, even with healthy open rates, often signal vague positioning or overly product centric language.
Sales metrics for managers frequently rely on this KPI to guide coaching conversations. Reviewing replies, both positive and negative, provides concrete feedback on what prospects care about and where reps need sharper discovery framing.
9. Meetings Booked
Unlike raw activity numbers, meetings booked reflect both effort and skill.
A rep may send hundreds of emails or make dozens of calls, yet struggle to secure meetings if messaging lacks relevance or confidence. Strong performance here indicates alignment between targeting, outreach, and qualification.
In sales performance dashboards, meetings booked often act as a leading indicator for pipeline growth. Consistent meeting volume keeps opportunity flow steady and reduces pressure later in the quarter.
10. Follow Ups Sent
Follow ups sent track the number of additional touches after initial contact.
This sales productivity metric measures persistence and process discipline.
Most deals require multiple interactions before moving forward. Prospects get busy, messages get missed, and timing shifts. Follow ups maintain visibility and signal professionalism. Low follow up activity almost always leads to pipeline leakage, even when initial outreach performs well.
Sales metrics best practices recommend tracking follow ups alongside response rates and meetings booked. This combination reveals whether reps abandon opportunities too early or apply consistent pressure that advances deals.
11. Social Media Interactions
Social media interactions measure meaningful engagement with prospects on platforms like LinkedIn. This sales activity metric supports relationship building long before formal sales conversations begin.
Modern buyers research vendors independently.
They notice comments, shared insights, and thoughtful engagement well before replying to an email or answering a call. Social interactions build familiarity and trust, softening outreach and improving response likelihood later.
While social engagement rarely closes deals on its own, it strengthens the overall sales funnel. In sales performance metrics reporting, this KPI often complements email and call data to provide a fuller picture of prospect touchpoints.
Conversion and Outcome Metrics

12. Lead Conversion Rate
Lead conversion rate shows how effectively teams qualify prospects. High conversion indicates strong targeting and discovery. Low conversion highlights lead quality or messaging gaps.
13. Win Rate
Win rate reflects overall sales effectiveness. It also supports accurate forecasting and identifies coaching opportunities across the team.
14. Average Deal Size
Average deal size affects revenue growth without increasing volume. Upsells, cross sells, and better positioning often raise this metric.
15. Sales Cycle Length
Sales cycle length measures speed. Shorter cycles free up resources and improve cash flow. Longer cycles reveal friction points that deserve attention.
Growth and Pipeline Metrics
16. Quarterly Sales Growth
Quarterly growth offers short term clarity. It supports resource planning and seasonal adjustments that annual numbers often hide.
17. Year Over Year Growth
Year over year growth evaluates long term strategy. It shows whether sales investments compound or stall over time.
18. Number of Customers in the Sales Funnel
This pipeline metric shows future revenue potential. It also highlights where prospects drop off before closing.
19. Value of Ongoing Sales
The total value of open opportunities supports revenue forecasting. When paired with conversion rates, it offers realistic expectations rather than optimistic guesses.
20. Sales by Channel
Sales by channel shows where revenue originates. Teams use this metric to allocate budget, headcount, and training more effectively.
21. Weighted Pipeline Value
Weighted pipeline value adjusts opportunity size by close probability. It provides a grounded forecast that leadership teams trust.
Team Health and Efficiency Metrics
Revenue numbers often get the spotlight, but team health and efficiency metrics quietly determine how sustainable that revenue really is.
These sales performance metrics focus on people, processes, and momentum. They help sales leaders understand not just what the team is producing, but how the work environment, coaching quality, and operational flow contribute to long term success.
When tracked alongside sales KPIs and sales outcome metrics, these indicators provide early warning signals that revenue alone cannot reveal.
22. Employee Turnover Rate
Employee turnover rate measures how frequently sales reps leave the organization over a defined period.
High turnover often points to deeper structural issues. Burnout from unrealistic quota attainment expectations, weak frontline management, unclear career progression, or compensation plans that feel unfair can all push reps out the door. In sales organizations, turnover also carries hidden costs.
New hires require ramp time, training resources, and close supervision before they contribute meaningful revenue. During that gap, pipeline velocity slows and existing reps shoulder extra workload.
From a sales analytics perspective, turnover should always be reviewed alongside sales productivity metrics and rep engagement scores.
A spike in churn among top performers signals a far more urgent problem than turnover among consistently underperforming reps. Strong sales metrics reporting connects turnover trends with coaching frequency, quota changes, and incentive adjustments so leaders can act before revenue erosion becomes visible.
23. Coaching Impact Score
Effective coaching shows up in tangible metrics.
Improved conversion rates, higher average deal size, shorter sales cycle length, or better pipeline hygiene all indicate that coaching sessions translate into execution. Without tracking impact, coaching risks becoming a time consuming ritual that feels productive but delivers little return.
Sales metrics for managers benefit greatly from this KPI. It highlights which coaching approaches actually move the needle and which need refinement. It also helps identify high leverage areas, such as discovery calls, objection handling, or follow up discipline, where small improvements create outsized revenue gains.
In high performing organizations, coaching impact scores often correlate with stronger quota attainment and lower employee turnover rate. Reps who see measurable improvement tend to stay engaged and confident, reinforcing the connection between people development and sales efficiency metrics.
24. Rep Engagement Score
Rep engagement score reflects motivation, morale, and emotional investment in the role.
Engaged reps show up differently in activity metrics. They follow up consistently, personalize outreach, and maintain cleaner pipelines.
Over time, this translates into stronger sales conversion metrics and healthier revenue metrics. Disengaged reps, on the other hand, may still hit basic activity numbers while mentally checking out, leading to poor quality interactions and rising churn risk.
Sales leaders often underestimate how closely engagement ties to sales performance indicators. Changes in comp plans, territory structure, or management style often surface first in engagement scores before they appear in revenue reports. Monitoring this metric allows leaders to address burnout, clarify expectations, and reinforce purpose before performance declines.
Among sales metrics best practices, engagement should never stand alone. It gains meaning when viewed alongside coaching impact, turnover trends, and sales productivity metrics.
25. Pipeline Velocity
This metric accounts for deal size, win rate, sales cycle length, and the number of active opportunities.
Together, these factors reveal how effectively a team converts effort into revenue over time. High pipeline velocity means deals move steadily forward, resources stay productive, and forecasts feel reliable. Low velocity signals friction, often hidden behind surface level activity metrics.
Pipeline velocity plays a central role in sales performance dashboards because it connects leading and lagging sales metrics.
Activity creates opportunities, conversion rates advance them, and cycle length determines how fast revenue lands. When velocity slows, leaders can trace the cause back to specific breakdowns, such as weak qualification, stalled approvals, or inconsistent follow ups.
For sales metrics benchmarks, pipeline velocity offers one of the clearest comparisons across teams and industries. It shows not just how much a team sells, but how efficiently it sells, making it one of the most valuable sales efficiency metrics for long term growth.
Sales Metrics Across Industries and Tools
SaaS teams focus on recurring revenue, churn, and expansion. Understanding how sales performance metrics vary between retail and SaaS industries helps leaders choose the right benchmarks.
Modern CRM platforms answer questions like what are the key sales performance metrics used by top CRM platforms and which software tools offer the best dashboards for tracking sales performance metrics.
Most leading tools support real time sales analytics, customizable dashboards, and integration with sales automation systems. Many teams also ask can I integrate sales performance metrics tracking into my existing sales automation tool. In most cases, the answer is yes, especially with cloud based CRMs.
Benchmarking against industry standards requires reliable data sources and realistic comparisons. Sales metrics benchmarks help leaders understand where they stand and what improvement looks like in real terms.
Bringing It All Together
Sales performance metrics tell a story when viewed together.
Activity metrics show effort - so on and so forth. You get the point by now.
In any capacity, a top performing company focuses on a balanced set of leading vs lagging sales metrics. They track sales metrics examples that support daily execution while keeping sales KPIs aligned with long term goals.
So, it’s time for you to set up these indicators at various checkpoints and see how things pan out in the long run. This is the best way of identifying potential leaks, instead of haphazardly looking for a solution when it’s already too late.
Good luck!


Embed Trellus Parallel Dialer Within Your SEP & 4x Your Conversations