Our Top Picks


All thanks to different kind of outreach research and lead prospecting tools these days, sales teams are not short on data.
On the contrary, they are drowning in oodles of data that takes quite a while to sort through to reach a meaningful conclusion from sales conversion point of view.
CRM dashboards refresh every second, sales KPI metrics multiply across tools, and weekly reviews are packed with charts. Yet almost seven out of ten B2B reps still miss quota.
That disconnect is not accidental.
Most teams track what is easy to measure instead of what actually predicts revenue. Calls logged, emails sent, meetings scheduled. These numbers feel productive but rarely explain why pipeline stalls, why forecasts miss, or why strong reps suddenly underperform.
The real advantage in modern sales comes from understanding activity to revenue correlation, spotting opportunity progression bottlenecks early, and building forecast reliability indicators that sales leaders can trust.
This breakdown focuses on sales KPI metrics that surface revenue efficiency indicators, hidden sales performance correlations, and productivity causal factors that most teams overlook.
We’ll start with daily activity signals, because those are the earliest places revenue either accelerates or quietly leaks.
Beyond just tracking calls and meetings, forward-thinking sales leaders measure how efficiently their payroll converts into revenue—a fundamental indicator of team health and profitability.
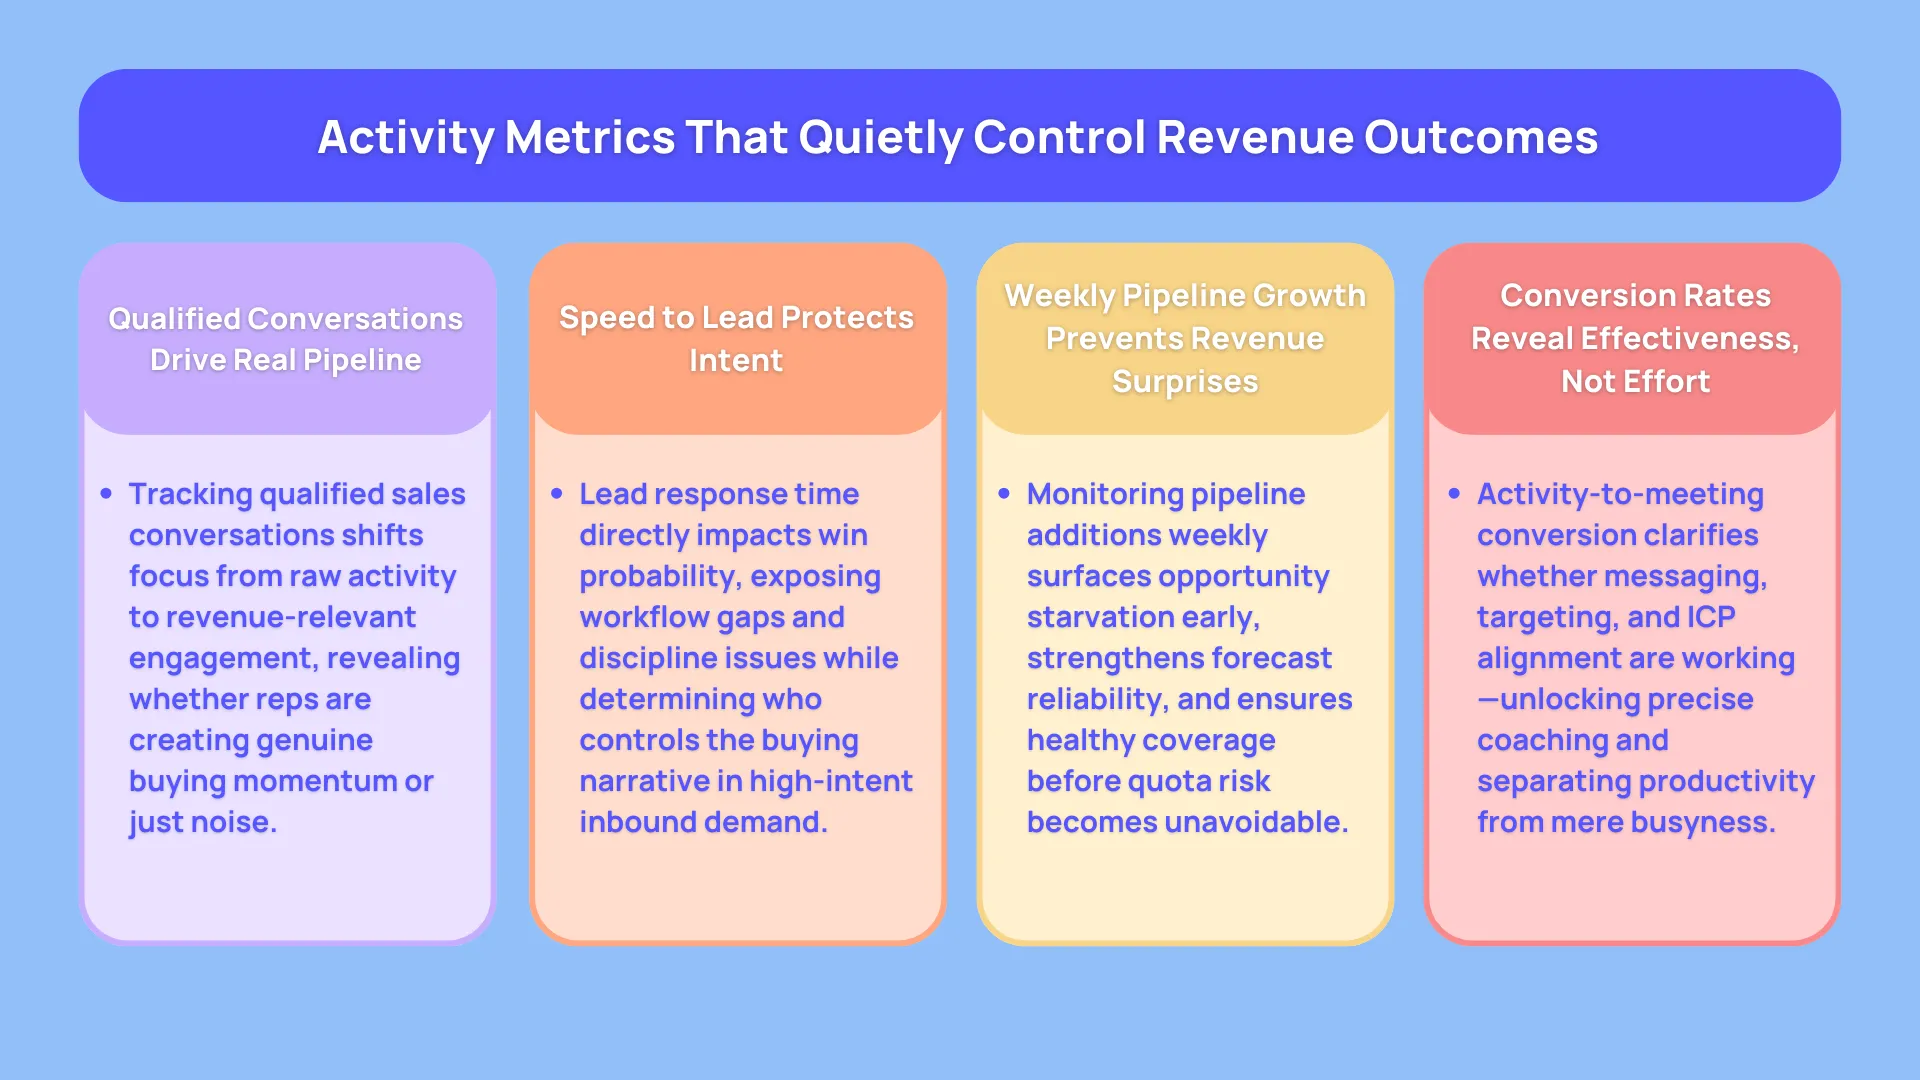
Activity Metrics That Quietly Control Revenue Outcomes
Daily sales activity metrics are often treated like rep scorekeeping.
That mindset misses the point. These numbers are not about pressure or micromanagement. They are early warning systems.
When tracked correctly, they reveal sales discipline adherence tracking, rep effectiveness multipliers, and output to effort analytics long before pipeline damage shows up in monthly reports.
Qualified Sales Conversations
Most sales teams still celebrate volume. High call counts. Long email cadences. Packed calendars. None of those guarantee revenue.
Qualified conversations are different. They represent live dialogues with prospects who match your ICP and show real buying signals. These conversations are the foundation of pipeline health composite scores.
A qualified conversation includes clear relevance, mutual engagement, and a path to the next step. It is not a rushed pitch or a polite brush off.
Why this metric changes everything
Qualified conversations directly influence opportunity creation quality. When this number drops, pipeline fill slows. When it inflates artificially, win rates collapse later. This metric acts as a rep level productivity ratio that ties effort to actual revenue potential.
Sales leaders who track this daily gain deep sales data observability into messaging quality, list accuracy, and early stage qualification discipline.
What strong benchmarks signal
For SDRs, fifteen to twenty qualified conversations per day usually indicate healthy list targeting and message resonance. For AEs, eight to twelve per day reflects deal complexity and average contract value.
When teams push far above these ranges, deal quality often degrades. When they fall short, quota trend forecasting becomes unreliable within weeks.
This KPI supports advanced quota attainment diagnostics because it shows which reps create real pipeline versus noise.
Lead Response Time for Inbound Demand
Inbound leads arrive with intent baked in. They already raised their hand. The only variable left is speed.
Lead response time measures how quickly a rep engages once interest appears. This is one of the most overlooked revenue efficiency indicators in SaaS.
Why speed impacts win trajectory pattern detection
Fast response creates momentum. Slow response creates competition. In high intent scenarios, the first rep to engage often sets the buying narrative and controls the evaluation timeline.
Teams tracking this metric gain early visibility into forecast accuracy scoring. Late responses lead to inflated pipeline that quietly dies mid funnel.
Operational insight hidden inside this KPI
Lead response time also reveals sales discipline adherence tracking issues. Slow responses usually point to unclear ownership, notification failures, or poor workflow design inside CRM systems.
Top sales KPI metrics recommended for SaaS companies almost always include this one because it connects marketing spend directly to revenue attribution precision.
Best in class teams aim for sub five minute response times. Anything beyond an hour sharply reduces lead quality to win analytics.
Weekly Pipeline Additions
Pipeline additions are not a vanity number. They are a survival metric.
Every week without enough new opportunities increases revenue risk in future months. This KPI supports pipeline movement velocity metrics and exposes opportunity starvation before it becomes a panic.
Why weekly tracking matters
Monthly reviews arrive too late. Weekly pipeline growth allows sales leaders to identify sales performance anomaly spotting early. If opportunity creation dips for two consecutive weeks, quota misses become mathematically inevitable.
This metric also strengthens strategic sales insight modeling. It shows whether growth relies on a few large deals or a steady flow of qualified opportunities.
Healthy pipeline coverage usually sits between three to five times quota, adjusted for win rates and cycle length. Without that buffer, forecast reliability indicators collapse.
Activity to Meeting Conversion Rate

Activity to meeting conversion rate measures how many outbound touches convert into booked meetings. It reveals hidden sales performance correlations between messaging, targeting, and buyer readiness.
Why this KPI unlocks coaching leverage
Low conversion here rarely means lazy reps. It usually signals list quality problems, unclear value articulation, or misaligned ICP assumptions.
Sales leaders who track this metric gain sales execution benchmarking tools that separate effort from effectiveness. It is one of the clearest rep effectiveness multipliers available.
Cold outreach conversion around two to three percent is normal in competitive markets. Warm outreach often reaches fifteen to twenty percent. Anything below those ranges calls for sales cycle friction analysis at the top of the funnel.
Revenue and Efficiency KPIs That Separate Growth From Noise
Once activity metrics are healthy, the real leverage comes from understanding how efficiently revenue is created. These sales KPI metrics explain why two teams with identical pipeline sizes can produce wildly different results.
This is where revenue attribution precision, revenue efficiency indicators, and hidden sales performance correlations start to surface.
Customer Lifetime Value as a Revenue Quality Signal
Customer Lifetime Value is often treated as a finance metric. In reality, it is one of the strongest sales effectiveness indicators available.
CLV measures the total revenue a customer generates across their entire relationship with your company. For SaaS teams, this includes recurring revenue, expansions, renewals, and cross sell motion.
Why CLV matters more than top line bookings
High booking volume with low CLV creates fragile growth. It signals poor ICP alignment, discount driven deals, or customers who churn before expansion. Strong CLV points to disciplined qualification, clear value positioning, and durable use cases.
CLV also plays a central role in revenue attribution precision. When paired with acquisition source data, it reveals which channels, segments, and reps produce customers that actually stay.
Sales leaders who track CLV gain customer lifecycle conversion markers that help refine targeting and coaching.
This metric is especially useful when paired with advanced quota attainment diagnostics. Reps closing fewer deals with higher CLV often outperform volume closers over time.
Monthly Recurring Revenue and Annual Recurring Revenue
MRR and ARR are not just accounting metrics. They are live indicators of sales momentum and retention health.
MRR tracks predictable monthly income, while ARR annualizes that value for longer term planning. Together, they provide forecast reliability indicators that leadership teams rely on.
What these metrics reveal beyond growth
MRR movement exposes expansion success, contraction risk, and churn pressure. When new bookings rise but net MRR stays flat, revenue leakage diagnostics become necessary.
ARR supports quota trend forecasting across segments. Enterprise heavy pipelines behave very differently from SMB driven motion, and ARR trends highlight that divergence early.
For SaaS teams evaluating sales KPI benchmarks for B2B vs B2C industries, MRR volatility tends to be higher in SMB and B2C environments, while enterprise ARR grows slower but compounds longer.
These metrics also integrate well with sales performance anomaly spotting. Sudden MRR drops often trace back to onboarding friction or mis sold expectations rather than sales effort.
Conversion Rates Across the Funnel
Conversion rates remain foundational, but their real power comes from stage level analysis.
Instead of tracking a single lead to close number, high performing teams monitor each transition. Lead to meeting. Meeting to opportunity. Opportunity to close.
Why stage level conversion matters
Each stage conversion highlights opportunity progression bottlenecks. A strong top of funnel with weak mid funnel conversion often signals poor discovery or unclear qualification. Strong mid funnel with weak close rates points to pricing friction or stakeholder misalignment.
Conversion rates also enable sales cycle friction analysis. Deals rarely stall randomly. They stall at predictable moments where value clarity drops or risk increases.
Sales leaders who monitor these transitions gain strategic sales insight modeling that supports targeted coaching instead of generic feedback.
This metric also strengthens activity to revenue correlation by tying daily effort directly to funnel movement.
Compound Performance Metrics That Predict Revenue Speed
Some KPIs only become powerful when combined. These compound metrics reveal how fast revenue moves and where it slows down.
Sales Velocity as a System Health Indicator
Sales velocity combines opportunity count, deal size, win rate, and cycle length into one metric. It answers a simple question. How fast does money move through your pipeline.
Why velocity outperforms isolated KPIs
A healthy pipeline with slow velocity still misses targets. A smaller pipeline with high velocity can outperform expectations. Velocity exposes productivity causal factors across the entire system.
Sales velocity supports pipeline movement velocity metrics and forecast accuracy scoring. Small improvements across multiple inputs compound rapidly.
Sales leaders tracking velocity gain deep sales data observability into how pricing, qualification, and process design interact.
A ten percent improvement quarter over quarter often signals sustainable growth rather than short term spikes.
Win Rate as a Quality Multiplier
Win rate measures the percentage of opportunities that close successfully. While simple on the surface, it carries massive leverage.
Why win rate reveals hidden issues
Declining win rates usually reflect upstream problems. Poor ICP fit, weak discovery, or inflated pipeline created to satisfy reporting expectations.
Strong win rates indicate sales discipline adherence tracking is working. Reps qualify rigorously, manage stakeholders effectively, and position value clearly.
Win rate also supports win trajectory pattern detection. Teams can identify which deal profiles close reliably and which consistently stall.
Top teams regularly review win rate by segment, deal size, and source to strengthen sales execution benchmarking tools.
Average Deal Size as a Revenue Accelerator
Average deal size often changes quietly, but its impact compounds dramatically.
Why deal size matters beyond revenue
Increasing deal size without extending cycle length improves sales velocity and rep productivity ratios simultaneously. Shrinking deal size often hides discounting behavior or weak value articulation.
This metric also supports revenue efficiency indicators. Higher deal sizes usually reduce cost per dollar of revenue when acquisition costs stay stable.
Sales leaders tracking this KPI gain early warning signals around margin erosion and expansion opportunity quality.
Sales Cycle Length and Friction Signals
Sales cycle length measures how long deals take to close. Long cycles reduce forecast reliability and strain rep capacity.
What long cycles really indicate
Extended cycles rarely mean thoughtful buyers. They usually reflect unclear next steps, internal approvals delayed, or unresolved risk concerns.
Sales cycle friction analysis pinpoints where deals slow down. Security reviews, procurement delays, or missing executive alignment often surface here.
Shortening cycle length improves output to effort analytics. Reps close more deals without increasing activity volume.
Benchmarks vary significantly across SMB, mid market, and enterprise segments, reinforcing the importance of sales KPI benchmarks for B2B vs B2C industries.
.jpeg)

Embed Trellus Parallel Dialer Within Your SEP & 4x Your Conversations