
Percentage Points vs Percent Change in a Call Report
Calculate percentage-point and relative changes from the original counts, choose the right baseline, and write a reporting sentence that keeps rate and volume separate.
On this page
By Trellus Team ·
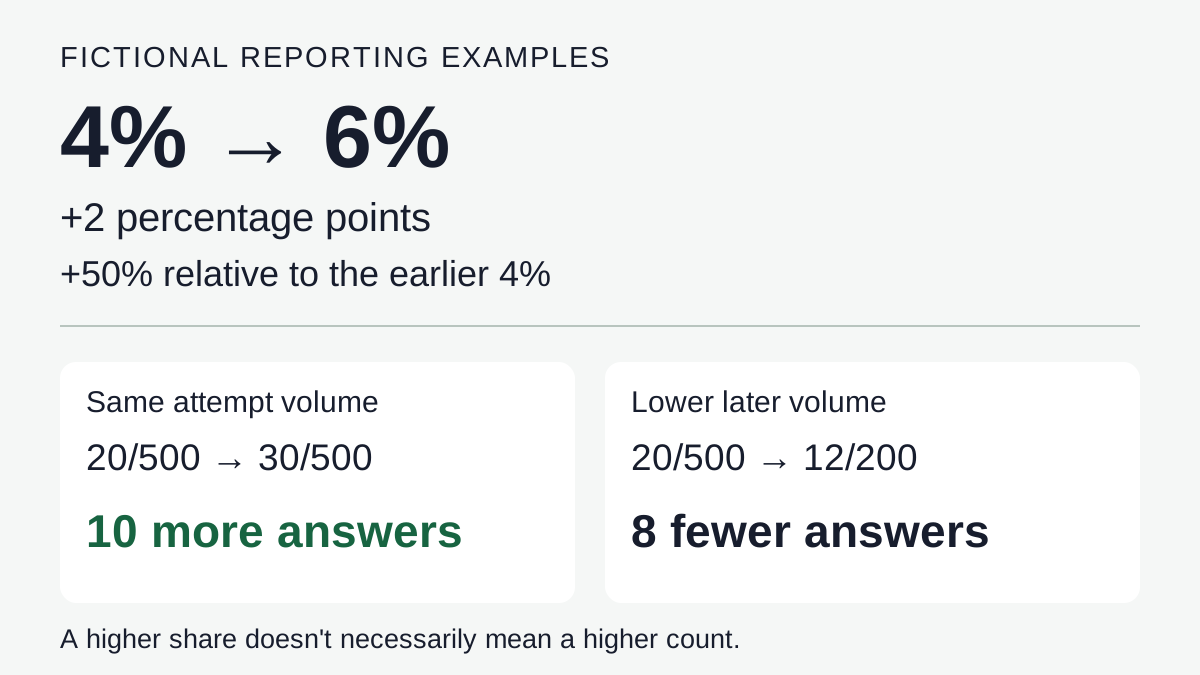
A call answer rate that moves from 4% to 6% is up 2 percentage points. It's also up 50% relative to the earlier 4% rate. Both statements are correct. “Up 50 percentage points” is not.
For a weekly report, lead with the two rates and their percentage-point difference. Add the relative change if it helps explain the size of the movement, and keep the underlying counts nearby. That lets a reader distinguish a higher answer share from a larger number of answered calls.
The examples below use fictional counts to show the arithmetic. They aren't calling benchmarks, Trellus results or recommended activity targets. The worksheet at the end is a manual aid for correcting a reporting sentence.
Start with what the report is counting
Suppose “answer rate” means the share of eligible attempts on which the intended person answered. In the first period, 20 of 500 attempts meet that rule. In the second, 30 of 500 do. Every included attempt has a known outcome, and the definition stays the same.
Those conditions matter. If the first report counts any answered line and the second counts only intended-person answers, subtracting the displayed percentages won't describe a consistent metric. Decide whether you're counting answers, conversations, people or attempts before calculating a change. The connect-rate guide explains those distinctions.
Write down the period and time zone too. A full week and a partly finished week can have different volumes and audiences. Correct arithmetic doesn't settle whether they make a useful comparison.
Two calculations, two questions
Calculate each rate from its counts first:
- Earlier rate: 20 ÷ 500 × 100 = 4%.
- Later rate: 30 ÷ 500 × 100 = 6%.
The percentage-point change is the later percentage minus the earlier percentage: 6 − 4 = +2 percentage points, often shortened to +2 pp. It answers, “How far apart are these two percentage rates?” Eurostat's percentage-point definition uses that distinction.
The relative percent change divides the difference by the earlier rate, then multiplies by 100: (6 − 4) ÷ 4 × 100 = +50%. It answers, “How large is this change compared with where we started?” The equivalent formula is (later rate ÷ earlier rate − 1) × 100, as in Eurostat's percentage-change reference.
Use the same units on both sides. You can calculate (0.06 − 0.04) ÷ 0.04 × 100 or (6 − 4) ÷ 4 × 100. Mixing 0.06 with 4 produces the wrong result. When subtracting fractional rates, multiply the difference by 100 to express it in percentage points.
A clear report says: “The intended-person answer rate rose from 4% to 6%, a 2-percentage-point increase, or 50% relative to the earlier rate.” The relative number supplements the baseline; it doesn't replace it.
A higher rate can come with fewer answers
Now change the later attempt count. Keep the first period at 20 answers from 500 attempts, but make the second 12 answers from 200 attempts.
| Comparison | Earlier | Later | Rate movement | Observed answers |
|---|---|---|---|---|
| Equal attempt volume | 20 / 500 = 4% | 30 / 500 = 6% | +2 pp; +50% relative | 20 → 30: up 10 |
| Lower later volume | 20 / 500 = 4% | 12 / 200 = 6% | +2 pp; +50% relative | 20 → 12: down 8 |
The second case isn't a contradiction. The rate describes the fraction of attempts with the chosen outcome. The count describes how many such outcomes occurred. Here, the later period has a larger fraction but fewer attempts and fewer observed answers.
Don't write “50% more answers” for that second case. A suitable sentence is: “The answer rate rose from 4% to 6% (+2 pp; +50% relative to 4%), while observed answers fell from 20 to 12 as attempts fell from 500 to 200.” This reports the quantities without claiming that the volume change caused the rate change.
You might also say that 6% corresponds to 30 answers per 500 attempts. That's a common-volume illustration, not the second period's actual answer count or a forecast for another 500 calls. Don't substitute it for the 12 observed answers. If audience, timing or list composition changed, use the call-list comparison guide before drawing a process conclusion.
The baseline changes when you reverse direction
Going from 6% back to 4% is a decline of 2 percentage points. The relative change is (4 − 6) ÷ 6 × 100 = approximately −33.3%, not −50%.
The earlier value is now 6%, so the same two-point distance is a smaller fraction of the baseline. A 50% rise followed by a 50% fall doesn't return a rate to its starting value: 4% × 1.5 × 0.5 = 3%.
For a trend report, state which period is the baseline and keep that choice consistent. If you compare each week with the preceding week, label those week-over-week changes. If every week is compared with one starting week, name that fixed baseline instead. Don't switch methods halfway through a chart without explaining it.
Handle zeros and rounding before writing the headline
For 0 answers from 100 attempts followed by 2 from 100, the rates are 0% and 2%. The increase is 2 percentage points. Relative percent change is undefined because its starting denominator is zero. Report the counts and point change; don't call it an infinite improvement or quietly replace zero with a small positive number.
That's different from having zero eligible attempts. With no attempts, the answer rate itself is undefined, not 0%. Keep “no attempts” separate from “100 attempts, no answers.” You can't calculate a comparable rate change from a period whose rate is unavailable.
Rounded rates can hide a nonzero baseline or distort a relative change. Suppose the original counts are 19/500 and 31/500. Their rates are 3.8% and 6.2%. The increase is 2.4 percentage points and approximately 63.2% relative to 3.8%.
If the dashboard rounds those rates to whole percentages, it shows 4% and 6%. Calculating from that display would instead produce 2 points and 50%. Use the original counts or sufficiently precise rates, calculate the changes, and round only the reported results. If all you have is a rounded screenshot, label any calculation from it as approximate rather than pretending to recover the original values.
Correct the reporting sentence, not just its symbol
Consider this draft note for the unequal-volume example: “Answers improved 50% after we changed the opener.” Replacing the percent sign with “pp” would make it less accurate. It confuses rate with count, omits the baseline and assigns a cause the arithmetic hasn't established.
Across the two reporting periods, intended-person answers were 20/500 attempts (4%) and 12/200 (6%). The answer rate rose 2 percentage points, or 50% relative to the earlier 4% rate. Observed answers fell by 8. We haven't established whether the opener change explains the rate movement.
Keep the actual period labels, time zone and any important definition or list changes beside that note. If somebody asks whether the difference is statistically persuasive or likely to persist, that's another question. The small-sample guide explains why a descriptive percentage isn't automatically a stable estimate. Neither a large relative change nor correct subtraction supplies a causal test.
Copy this change card into the next report
Metric and outcome rule: ____
Earlier period, later period and time zone: ____
Earlier count / eligible attempts: ____ / ____
Later count / eligible attempts: ____ / ____
Earlier rate and later rate, before display rounding: ____ → ____
Percentage-point change (later percentage − earlier percentage): ____ pp
Relative change, if the earlier rate is nonzero: ____% relative to ____
Observed outcome-count change (later count − earlier count): ____
Unknown outcomes, changed definitions or comparison limits: ____
Reporting sentence and next check: ____
Before sharing it, read the sentence without the chart. Can a colleague tell where the rate started, where it ended and how many outcomes occurred? If so, the report has done more than announce a big percentage: it has made the change understandable.
If your next question is how calling work and its saved results fit your CRM or sales engagement platform, use the dialer setup discussion. Confirm the actual fields and supported workflow there; this manual worksheet isn't a promise that a product calculates these changes for you.