
How Much Does a Small Call Sample Tell You?
Keep the count beside the percentage. Work through fictional Wilson intervals, check the assumptions and save a calculation note before generalizing from a small sample.
On this page
By Trellus Team ·
Four answers from twenty call attempts is a 20% answer share. The arithmetic isn't uncertain. The risky step is turning that small block into “we can expect one answer in five” for work you haven't observed.
Keep the count beside the percentage. If you want to estimate an underlying answer probability, first ask whether the calls fit a simple statistical model. Then show how imprecise the estimate is. A confidence interval can help with that second job; it cannot repair a handpicked sample, missing outcomes or a changing audience.
This guide uses fictional counts and a worked Wilson confidence-interval worksheet. It is a manual reporting method, not a Trellus benchmark or a claim that a product calculates these intervals. You can use it to write a more honest reporting note without making extra calls merely to reach a sample-size target.
Separate the recorded result from the estimate
Suppose you have a complete record of twenty eligible attempts, four with the defined answer outcome. For those twenty attempts, the answer share is exactly 4 ÷ 20 = 20%. You don't need a confidence interval to discover what fraction of that fixed, fully known group answered.
An interval answers a different question: what does this sample suggest about an underlying probability, assuming a particular repeatable process? That distinction matters when somebody wants to use today's percentage to plan tomorrow or describe a wider body of work.
Write the binary outcome in ordinary language before counting it. Here, “answer” means the intended person answered the attempt, and every included attempt has a known yes-or-no result under that rule. A receptionist, a voicemail and an intended-person conversation are not interchangeable merely because a report calls them all “connected.” Keep the same definition throughout the calculation.
Also name the unit. Twenty attempts, twenty distinct people and twenty conversations are different denominators. If you need to combine compatible groups into one observed rate, use the guide to combining call rates first. Pooling the counts correctly does not, by itself, make the resulting observations independent or their probabilities alike.
Check whether the simple model fits
The binomial model used here treats each included trial as an independent yes-or-no outcome with the same underlying probability. That is an assumption for the example, not a fact about ordinary calling lists. NIST's binomial distribution reference describes the model behind the calculation.
Calling work can depart from it quickly. Several attempts to one person may share that person's availability. A requested callback is different from a first cold attempt. Reps, regions, time windows and changes in the list can alter the chance of an answer. Having more rows doesn't make those differences disappear.
Check these points before applying the worksheet:
- Selection: Did you include a defined block of eligible work, or choose memorable calls and successful reps after seeing their results? A selected highlight reel is not a representative team sample.
- Completeness: Are all included outcomes known? Unknown or still-pending results are not automatic failures. Resolve or separately describe them using the call-outcome completeness audit.
- Dependence: Do attempts repeat people or belong to tightly related accounts or sessions? Don't treat them as independent evidence without a justified analysis. Simply deleting repeat attempts would also change the question.
- Stability: Is a common probability a reasonable working assumption for the question? A blended cold-and-callback total can describe the past while being a poor model for a new cold-only block.
If an important assumption is doubtful, report the observed counts and describe the issue. Don't attach a precise-looking interval and hope its width absorbs the problem. For a consequential estimate, get appropriate statistical help with a model and sampling plan that match the work.
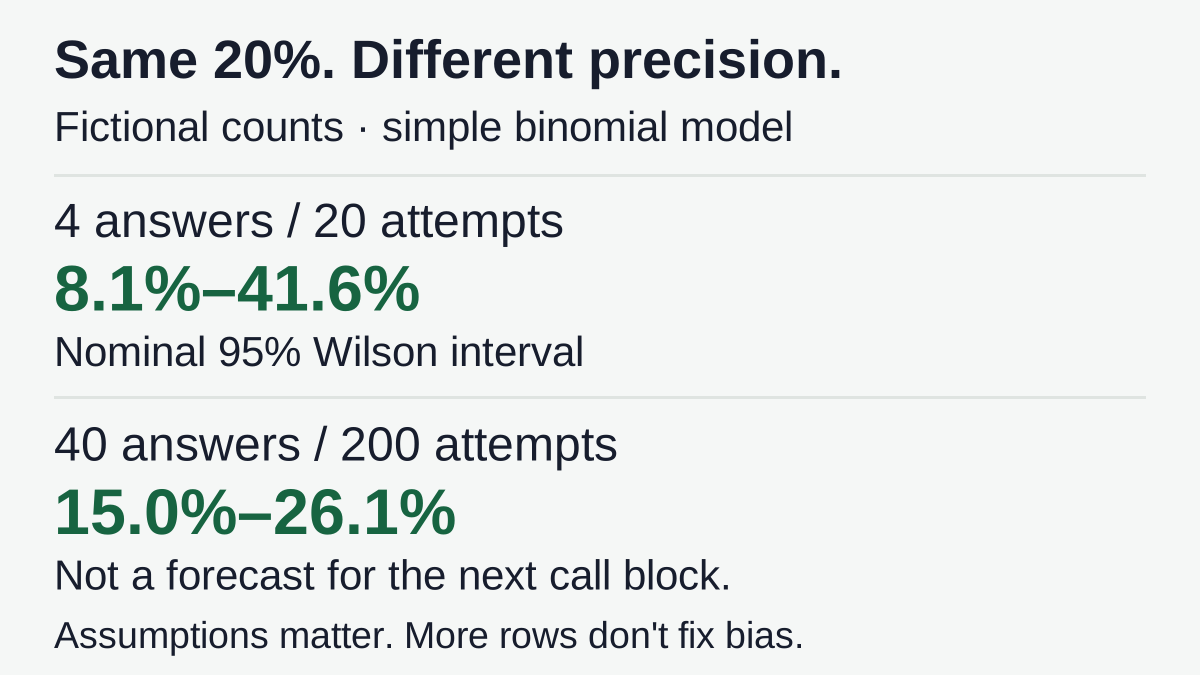
The same 20% can have very different precision
For the following fictional samples only, assume independent trials, one stable answer probability within each process, a consistent outcome rule and complete results. Calculate a two-sided nominal 95% Wilson score interval. These are illustrative sample sizes, not a recommendation to place twenty or two hundred calls.
| Answers / attempts | Observed share | Nominal 95% Wilson interval |
|---|---|---|
| 4 / 20 | 20% | 8.1%–41.6% |
| 40 / 200 | 20% | 15.0%–26.1% |
| 0 / 20 | 0% | 0%–16.1% |
Both of the first two rows report 20%. The smaller sample leaves a much wider interval. Showing “20%” alone hides that difference. Neither row establishes a standard for your team, and neither proves that a vendor, rep or list is better.
The zero row is worth keeping. No answers were observed in those twenty attempts, so the historical share is 0%. It does not follow that the underlying probability must be zero. A zero count can coexist with substantial uncertainty about that probability.
Don't read 8.1%–41.6% as a prediction that 95% of future calling blocks will land in that range. It is not a prediction interval for a future block's observed share.
What “95%” means here
The confidence level describes the procedure across repeated samples under its assumptions. A nominal 95% procedure aims for about 95% of the intervals constructed that way to cover the fixed underlying probability. For discrete binomial data, actual coverage can vary with the sample size and probability; “nominal” is deliberate.
Once this particular sample has been observed, the frequentist statement is not “there is a 95% probability that the fixed probability lies inside these two numbers.” Nor does the calculation give you a 95% chance of hitting a sales target. It measures one kind of model-based sampling uncertainty, not uncertainty about every business assumption.
Wilson is one method, not the only binomial interval. NIST's reference on confidence intervals for proportions gives the formula and discusses alternatives. Record the method when sharing the result so another reader can reproduce it.
Reproduce the worksheet from the counts
Let x be the number of answers, n the eligible attempts and p̂ = x/n. Use integer counts with n > 0 and 0 ≤ x ≤ n. With no attempts, there is no observed share or interval from this worksheet. For a nominal two-sided 95% interval, use z = 1.959963984540054.
d = 1 + z²/ncenter = (p̂ + z²/(2n)) / dhalf-width = z × √(p̂(1−p̂)/n + z²/(4n²)) / d
Lower endpoint = center − half-width
Upper endpoint = center + half-width
Calculate using proportions, not whole-number percentage inputs. For 4/20, enter 0.2 for p̂, not 20. The center is approximately 0.2483 and the half-width 0.1677, giving endpoints about 0.0807 and 0.4160. Multiply those endpoints by 100 only for the display: 8.1%–41.6% after rounding to one decimal place.
Keep the original counts and full-precision calculation. Round the final displayed endpoints, not each intermediate step. Wilson's center need not equal the observed share; don't move the interval to make it look symmetric around 20%. At boundary counts such as zero answers, numerical software may produce a tiny floating-point residue at the mathematical zero endpoint. Check that boundary rather than reporting a negative probability.
Use the result without turning it into a ranking
A practical note for the first row could read: “Four intended-person answers from twenty included attempts: 20%. Under an independent, stable-probability model, the nominal 95% Wilson interval is 8.1%–41.6%. The count is descriptive; the wider-process estimate is imprecise. We have not established that the model fits our calling work.”
For a real report, replace that last sentence with the actual assumption check, including unresolved limitations. If the rows repeat people or mix different kinds of work, lead with that problem. The numerical interval should not become the headline merely because you can calculate it.
Comparing two lists, openers or reps requires another analysis. Overlapping intervals do not prove equal performance; non-overlap is not a substitute for a planned comparison. The call-list comparison worksheet starts with audience and attempt differences that a one-rate interval cannot resolve.
There is no universal number of calls after which every percentage becomes reliable. The useful precision depends on the decision, the outcome probability and whether the model is appropriate. Choose the question and review plan before looking for a favorable result; repeatedly checking until an ordinary fixed-sample interval looks persuasive changes the statistical problem.
Keep this note beside the percentage
Question and wider process being estimated: ____
Observed window and time zone: ____
Eligible unit and binary outcome rule: ____
Selection rule, fixed before viewing results: ____
Answers x / attempts n / observed share: ____
Unknown or pending outcomes: ____
Repeated contacts or other dependence: ____
Audience or workflow changes: ____
Why the simple model is reasonable, or why no interval is reported: ____
Interval method, nominal level and rounded endpoints: ____
Decision this result can support—and what it cannot: ____
Owner and next review: ____
If you're evaluating calling software, take your reporting question to the dialer setup discussion and confirm the actual fields and supported workflow for your CRM or sales engagement platform. This worksheet does not establish any product's export, calculation or uncertainty-analysis features.
For the next report, make the smallest useful change: show “4/20, 20%” instead of “20%” alone. Add the model-based interval only when you can explain why it belongs there. Sometimes the right conclusion is simply that a short block doesn't yet support the larger claim.