
Right-Censored Data: Keep Open Deals in the Picture
Keep open opportunities in a duration report without inventing completion times. Includes a dated fictional cohort, checked arithmetic and a reusable reporting note.
On this page
By Trellus Team ·
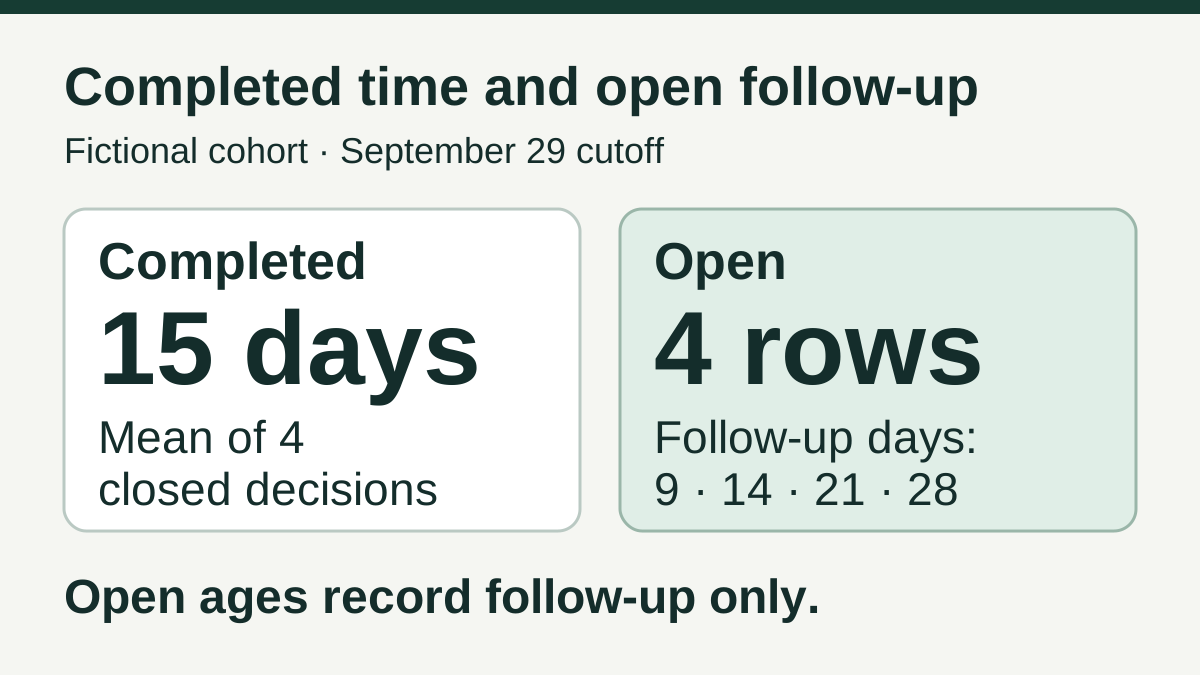
A report says the average sales cycle is 15 days. Four opportunities produced that number. Another four are still open, including one that has already been followed for 28 days. The arithmetic can be correct while the headline describes only part of the cohort.
Right-censored data records how long something was observed without the chosen event occurring. It doesn't supply the missing event time. For sales reporting, that distinction helps you keep an open opportunity's elapsed age separate from a completed sales cycle.
This guide uses a fictional eight-opportunity cohort and a fixed cutoff. It's a manual way to describe the available observations, not a forecast, a benchmark or a description of a Trellus report.
Choose the event before measuring the duration
First write down what starts the clock and what ends it. “Time to a first recorded closed decision” and “time to a win” are different questions. A lost opportunity is an observed event for the first question. It isn't a win for the second.
For this example, the clock starts when an opportunity enters the defined evaluation cohort. The event is its first recorded terminal decision: won or lost. Every row uses those same rules, and none has been reopened. The reporting cutoff is September 29, 2026 at 00:00 UTC.
The NIST handbook's explanation of censoring distinguishes an observed event time from time observed without that event. Here, an opportunity confirmed open at the cutoff contributes follow-up time, rather than a completed duration. That doesn't mean it will eventually close or tell us when it might do so.
Your actual start rule might use a different event. Keep it consistent, and save it with the report. The general sales-cycle definition is a starting point; the calculation still needs a precise start, endpoint and population.
Keep completed durations and open ages in separate columns
All dates in this fictional table are at 00:00 UTC. Elapsed days are the difference between the start and event or cutoff dates, without counting the start date as an extra day. The cohort includes all eight evaluation starts shown below; no row is removed because it remains open.
| Opportunity | Start | Status at cutoff | Observed event date | Completed days | Open follow-up days |
|---|---|---|---|---|---|
| A | September 1 | Won | September 9 | 8 | Not applicable |
| B | September 1 | Lost | September 13 | 12 | Not applicable |
| C | September 3 | Won | September 23 | 20 | Not applicable |
| D | September 5 | Lost | September 25 | 20 | Not applicable |
| E | September 1 | Open | Not observed | Not observed | 28 |
| F | September 8 | Open | Not observed | Not observed | 21 |
| G | September 15 | Open | Not observed | Not observed | 14 |
| H | September 20 | Open | Not observed | Not observed | 9 |
E has been observed open for 28 days. Its completed time to the defined event is unknown. Don't put 28 into the completed-days column, and don't replace the missing event time with zero. Each would turn follow-up information into an event that wasn't observed.
The rows have different amounts of follow-up because they started on different dates. A shared cutoff doesn't give every opportunity an equal observation period. H's nine days of follow-up shouldn't be read as evidence that it closes faster than E.
Label what the 15-day average actually describes
The four completed durations add to 60 days. Their arithmetic mean is:
Mean among the four observed closed decisions = (8 + 12 + 20 + 20) ÷ 4 = 15 days.
That label preserves the denominator. It doesn't estimate the average eventual completion time of all eight starts, and it doesn't measure the time to a win. The completed group contains two wins and two losses.
If you choose to show the mean among the two observed wins, it's (8 + 20) ÷ 2 = 14 days. Label it “mean duration among two observed wins,” and retain the other outcomes beside it. Changing the subset changes the question.
Mixing completed durations and open follow-up ages produces (60 + 28 + 21 + 14 + 9) ÷ 8 = 16.5 days. The calculation adds numbers successfully, but they don't all represent completed durations. Don't present that result as an average completed sales cycle.
This is related to the denominator discipline in the guide to combining sales call rates: write the question and preserve the inputs. Here, the extra distinction is whether the event time was observed at all.
Report the unfinished cohort without guessing its future
A useful descriptive summary can be short:
“Eight evaluation starts are included. At the September 29 cutoff, two are won, two lost and four remain confirmed open. The four observed closed decisions have a mean duration of 15 days. Open follow-up ages are 9, 14, 21 and 28 days. Event times for those open rows have not been observed.”
That summary doesn't need an invented completion date or a predicted win rate. It makes the incomplete follow-up visible. A colleague can see what the reported average includes and return to the source rows.
Keep a separate status for an opportunity whose state is unknown. A stale record last marked open doesn't prove the buyer remained in evaluation through the cutoff. Record the last reliable observation and the gap. Don't silently give it the same follow-up as a row confirmed open on the reporting date.
For an ongoing cohort, save the earlier snapshot when you publish a later one. A later decision may add a completed duration; it shouldn't rewrite what was known at the earlier cutoff. Explain corrections separately if an earlier record was wrong.
A win-specific question needs different outcome handling
The example counts won and lost as terminal decisions. If the question becomes “how long until a win?”, a lost opportunity is a different terminal outcome, not an administratively open observation. Keep the loss date and status visible.
Don't casually relabel losses as ordinary right-censoring and interpret a resulting curve as the chance of winning. A statistical analysis of one event in the presence of competing outcomes needs a suitable method and its assumptions. This reporting worksheet doesn't perform that analysis.
Be equally explicit about reopened opportunities. Decide whether a reopening begins a new evaluation episode or belongs to another defined process, and preserve the transition history. Changing that rule halfway through a comparison can change the measured durations even if the underlying buyer activity hasn't changed.
Before comparing teams or periods, check the start window, event definition, follow-up cutoff and outcome handling. Two reports headed “average cycle” may cover entirely different cohorts.
Save a cohort note beside the report
Use this card before sharing a duration headline. It records the reporting choices rather than copying buyer or financial details into another document.
- Question: Which event's timing are we describing?
- Start rule: What puts an opportunity into the cohort and starts its clock?
- Window and cutoff: Which starts are included, and through what exact date, time and time zone were outcomes checked?
- Observed outcomes: How many relevant events, other terminal outcomes, confirmed-open rows and unknown-status rows are present?
- Duration fields: Which values are completed event times, and which are only observed follow-up?
- Summary: What subset and denominator does each displayed number use?
- Exceptions: How are reopening, missing timestamps and unreliable status handled?
- Next update: Who will check the unresolved rows, and when will a new snapshot be saved?
If the goal is an estimated time-to-event distribution rather than a descriptive snapshot, get a statistical review of the cohort and censoring assumptions. Keeping the right fields is necessary preparation; it doesn't make an estimator appropriate by itself.
For an ordinary operating report, a clearly labelled completed-case mean with visible open follow-up is already more informative than a single number that hides unfinished work. Keep the event, the cutoff and the unknown times attached to the result.