
How to Compare Sales Funnel Conversion by Entry Cohort
Compare two fictional entry weeks, decide when their conversion rates are ready to report, and save a reusable cohort definition.
On this page
On Monday, your funnel report shows that 5 of 12 opportunities from one week reached the next stage. Only 3 of 10 from the following week have made it. Before you ask what changed, check whether the second group has had as much time to move.
An entry cohort is a group of records that entered the same stage or process during a defined period. To compare conversion, give each record the same amount of time from its own entry. If your window is 14 days, an opportunity that entered on September 1 has until September 15 at the same time of day. Another that entered on September 7 has until September 21. Both belong to the same entry week, with different individual deadlines.
Decide what earns a place in each count
Start with one record type and one qualifying transition. Suppose the question is how many new opportunities make it from Discovery to Evaluation within 14 elapsed days. Count each opportunity ID once, when it first enters Discovery. Look for the first Evaluation event after that entry and on or before the cutoff. Use one reporting timezone for both entry weeks.
If an opportunity drops out of Discovery and comes back, its return doesn't add a second row to this report. That rule makes sense for a first-entry conversion report. A manager studying how recycled opportunities perform would define a different report, using entries rather than opportunity IDs as the unit. The unit of analysis guide explains why that choice changes the denominator.
If your export starts after some opportunities were already in Discovery, the first entry may be missing. Set those records aside as unknown and disclose their count. Counting the first row you can see as the original entry can move older opportunities into the wrong week.
You can still see what happened after the window. Keep a late transition in the source data. It answers a different question, such as whether the opportunity ever reached Evaluation.
Work through two entry weeks
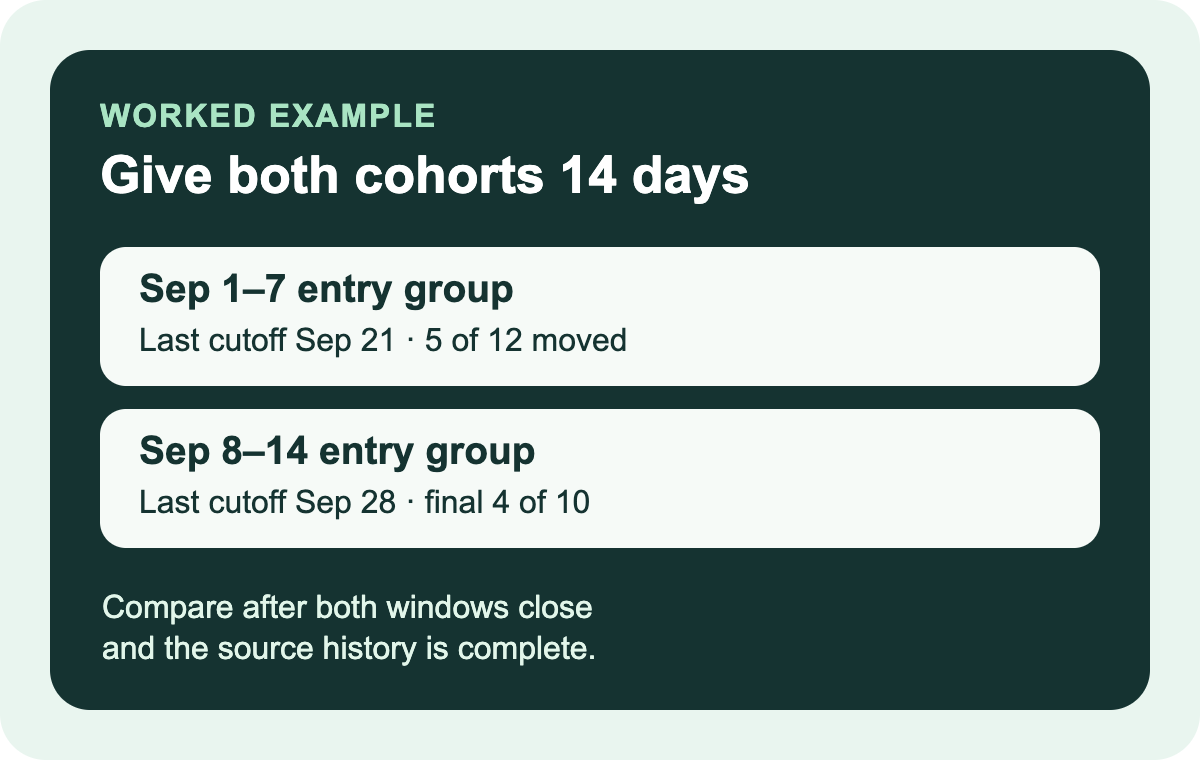
Imagine you export stage history on September 23. This fictional example uses UTC. The last opportunities in the two groups entered on September 7 and September 14. Their individual deadlines fall on September 21 and September 28 at the same time of day as their entries. Here is what the export shows:
| First entered Discovery | Unique opportunities | In-window evaluations observed | Can you compare the rates? |
|---|---|---|---|
| September 1–7 | 12 | 5 | Yes. All 12 had the full 14 days. |
| September 8–14 | 10 | 3 | Wait. Some of the 10 still have time to move. |
In the first cohort, one opportunity entered Discovery twice. It still accounts for one of the 12. Another reached Evaluation on day 16. Keep that event in the history, and leave it outside the five in-window evaluations.
The second cohort has three observed in-window evaluations so far. Calling that a final 30% would treat the records whose windows are still open as if they had already run out of time. Wait until the last record has its full 14 days and the stage history has loaded through that cutoff. An early read is useful if you label it “3 observed so far” and include the as-of date. If a fourth opportunity advances within its own window, the finished comparison is 5/12 (41.7%) versus 4/10 (40.0%). With groups this small, one record matters. Look at the counts and the underlying transitions before explaining a change in percentage.
A separate dashboard might show nine Evaluation transitions during September 15–21. That's a reasonable measure of activity during that week, and it can include opportunities from several entry cohorts. It won't tell you how many of the September 8–14 entrants converted within 14 days.
Save the rule beside the result
A short definition lets someone rerun the report without guessing at the filters:
- Entity and entry: One row per opportunity ID at its first verified entry to Discovery. Track records with unknown prior history separately.
- Cohort boundaries: Entry week in the reporting timezone, with an explicit start and end.
- Outcome: First Evaluation event after entry and on or before 14 elapsed days from entry.
- Readiness: Every entry in the cohort has reached its cutoff, and source events are loaded through that cutoff.
- Readback: Record the extraction time, denominator, numerator and any unresolved or missing stage history.
If the data arrives late, keep the latest cohort marked provisional. When the records are complete, save the version you used so the next reader can trace the calculation back to its source. That gives a sales manager a better place to start than a percentage that changes every time the report opens.