
Regression to the Mean: Read a Coaching Rebound Carefully
Separate an observed coaching rebound from causal proof. Includes checked before-and-after counts and a reusable review note.
On this page
By Trellus Team ·
Two reps have a poor week. Their manager gives them extra coaching. The next week looks better, and the improvement goes into the report as evidence that coaching worked.
It might have helped. But first ask why those two reps were chosen. If the answer is “they had the lowest numbers last week,” the comparison starts from an unusually low result. A rebound from that starting point doesn't isolate the effect of the coaching.
Regression to the mean helps explain this problem. Use it to examine the comparison, not to dismiss the rep's work or decide that improvement was imaginary. The fictional example below shows what to record before turning a recovery into a claim about impact.
Why choosing the lowest results changes the comparison
A rep's recorded result can reflect several things: the work they did, the audience they reached, the opportunities they had and ordinary variation in what happened. A particularly weak window may contain both a real problem and an unusually unfavorable set of outcomes.
Selecting people because of that weak window also selects for those unusually unfavorable outcomes. In a stable repeated-measurement setting, the selected group's next average may be less extreme even without an intervention. That tendency is called regression to the mean.
In their research tutorial on regression to the mean, Zhang and Tomblin explain how measurement error combined with selection on extreme scores can distort estimates of change. They also describe larger effects when measurements are less reliable and selection is more extreme. Their paper concerns research methods, not sales-team performance.
The sales implication is a question: how much does the way you selected this group affect what its before-and-after numbers can tell you? You can't answer that by looking at the rebound alone.
The tendency doesn't mean every struggling rep improves next week. Reps can have different underlying performance levels. A stable gap, a change in territory or a genuine improvement can all matter. The team average isn't a destination that each person's results must eventually reach.
A fictional report that makes the problem visible
Suppose six reps each have 40 eligible conversations in each of two reporting windows. For this example, an outcome means a specific next step agreed with the prospect and recorded under the same definition. Every included conversation has a known outcome, and a conversation can contribute at most one such outcome.
These are invented counts for a calculation, not customer data, a simulated experiment or a benchmark. They don't establish a stable probability for any rep. No coaching intervention is specified in this example; the table exists to examine the reporting claim.
| Rep | Window 1: agreed next steps / conversations | Window 2: agreed next steps / conversations | Selected after Window 1? |
|---|---|---|---|
| A | 2 / 40 | 5 / 40 | Yes |
| B | 3 / 40 | 6 / 40 | Yes |
| C | 6 / 40 | 5 / 40 | No |
| D | 7 / 40 | 7 / 40 | No |
| E | 10 / 40 | 8 / 40 | No |
| F | 12 / 40 | 9 / 40 | No |
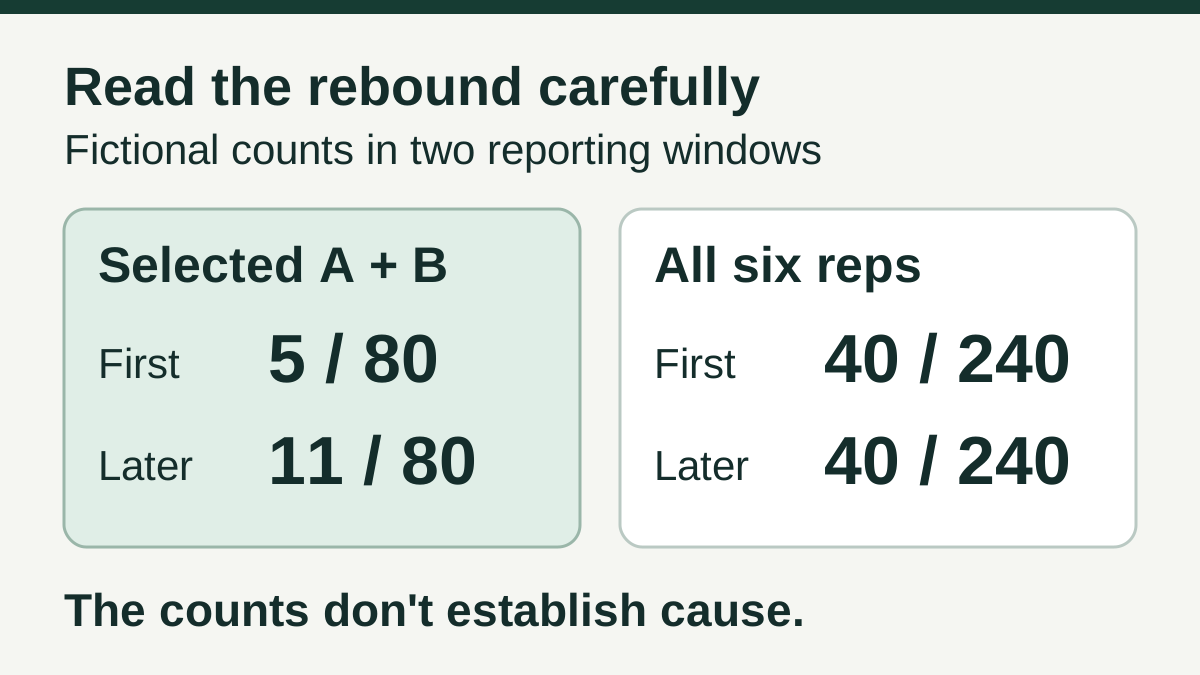
The manager selects A and B because they had the lowest Window 1 shares. Together, they move from 5 agreed next steps in 80 conversations to 11 in 80. Their recorded share rises from 6.25% to 13.75%, an increase of 7.5 percentage points.
Across all six reps, the totals are 40 agreed next steps from 240 conversations in each window: about 16.67% both times. E and F, the strongest first-window pair, move in the other direction, from 22 in 80 to 17 in 80.
The selected low group improved while the team total stayed the same. That doesn't prove regression to the mean caused the improvement. The rows contain no evidence about why outcomes changed. They show why a selected group's before-and-after increase can be an incomplete account of the team's work.
Nor does the unchanged team total prove that coaching would have no effect. There is no assigned intervention or valid treatment comparison here. Keep the arithmetic and the causal question separate.
Don't turn the remaining reps into an automatic control group
Now imagine that, in a real team, A and B received coaching after the first window. It would be tempting to compare their improvement with the change among C through F.
But the groups were created using the outcome you're about to compare. A and B were chosen for being unusually low; the rest were not. Calling the second group a “control” doesn't undo that difference. A larger rebound among the selected pair could still reflect selection, coaching, other changes or a mixture.
Even matching reps on one extreme week doesn't necessarily solve the problem. First establish what made someone eligible for support and what question the comparison is meant to answer. A planned comparison among similarly eligible reps can be more useful than selecting a low group and finding a convenient comparison afterward.
If you need to estimate the effect of a coaching program, design that evaluation before allocating it, with appropriate analytical help. Consider fair assignment, comparable work, spillover between teammates and the support everyone needs. Don't withhold necessary help just to preserve a spreadsheet comparison. This article isn't a causal adjustment formula.
Use more context without moving the starting line
Keep the window that triggered the coaching decision. Don't replace it with a more favorable baseline after seeing the later result. Then add relevant earlier windows so the reader can see whether the trigger was an isolated low point or part of a longer pattern.
Those extra observations help describe the starting situation. They don't automatically remove selection effects, make the work comparable or reveal the result the rep would have had without coaching.
Check what changed between windows. Did a rep move from new outbound contacts to requested callbacks? Did a new list arrive? Were fewer conversations included? Was the next-step definition changed? Record those facts beside the result. A real change in working conditions deserves attention rather than being squeezed into a statistical explanation.
Keep the numerator and denominator. If A's second window contains a different number of conversations, calculate from those counts. The guide to combining call rates explains why averaging rep percentages can answer a different question from pooling their work.
Also keep uncertainty separate from this selection problem. A wider interval can show that an estimate is imprecise under a stated model; it doesn't make an outcome-selected before-and-after comparison causal. The small-sample worksheet covers that different calculation.
Look for the behavior the coaching was meant to change
A recovery in agreed next steps isn't the same observation as a rep using a coached skill. If the session focused on asking a relevant follow-up, review whether the opportunity arose and what the rep actually did.
The coaching adoption review provides a separate way to record relevant opportunities, observed use and missing context. It can help you discuss practice without claiming that every subsequent meeting was caused by the session.
Listen to ordinary calls as well as the memorable success after coaching. If the recordings were chosen because they demonstrate the new behavior beautifully, say that they are examples for practice. They don't show how often the behavior appears in ordinary work. Use a stated call-selection method when preparing the review.
Keep helping the rep while you improve the evidence. You can say that the rep tried a useful question, that a later conversation went well, or that an obstacle was resolved. Each is worth recording on its own terms.
A before-and-after note you can reuse
Before the next coaching review, put these fields in the team document or coaching record your managers already use:
- Question: Are we checking a behavior, describing a later result or trying to estimate coaching's effect?
- Selection: Who was included, when was that decided, and did the measured outcome determine inclusion?
- Starting work: Triggering window, earlier context, original counts and outcome definition.
- What happened: Coaching delivered, other support, work assigned and known changes in audience or conditions.
- Later work: Same definitions, actual counts, missing information and observed behavior.
- Conclusion: What improved, what remains unexplained and what the next review will examine.
A note for the fictional table might read: “A and B were selected after the lowest first-window outcomes. Their combined agreed-next-step share increased from 5/80 to 11/80. All six reps together remained at 40/240. Selection was based on the first outcome, and the table doesn't identify an intervention or explain the changes. Report the selected group's recovery; don't label the 7.5-point increase a coaching effect.”
For a real coaching review, replace those rows with your actual record of the support and the work. If an explanation is still unknown, leave it unknown. The next useful action might be reviewing a behavior, correcting an audience mismatch or planning a better comparison—not calculating a more impressive improvement percentage.
Give the rep credit for the work you can observe, and keep the report's conclusion within what the comparison can show.